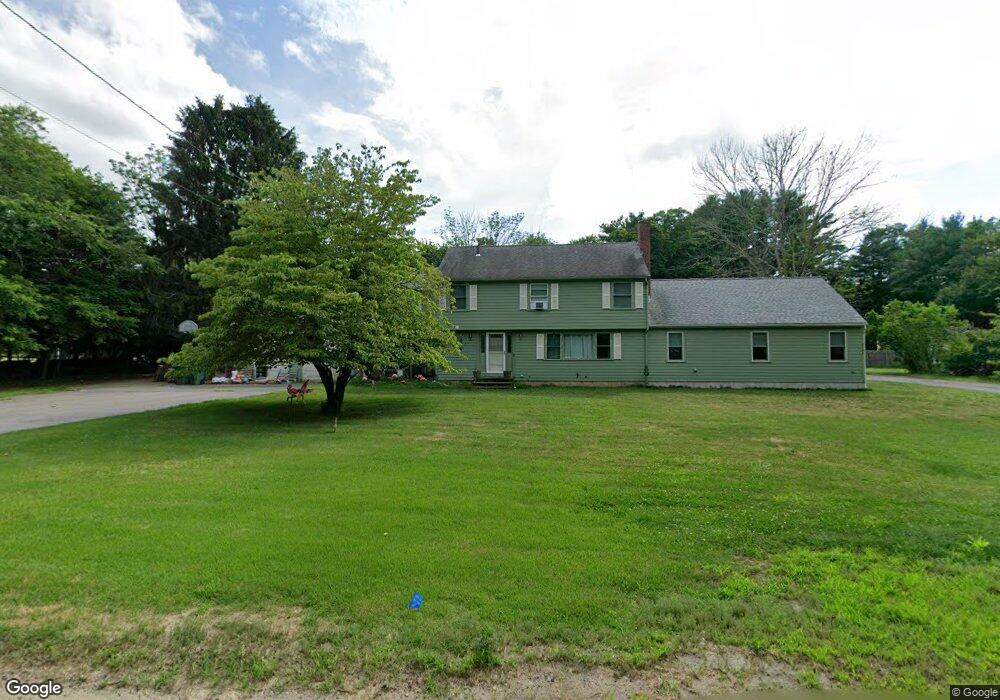
279 High St Pembroke, MA 02359
Estimated Value: $922,975 - $1,003,000
4
Beds
4
Baths
3,700
Sq Ft
$257/Sq Ft
Est. Value
About This Home
This home is located at 279 High St, Pembroke, MA 02359 and is currently estimated at $950,244, approximately $256 per square foot. 279 High St is a home located in Plymouth County with nearby schools including Pembroke High School.
Ownership History
Date
Name
Owned For
Owner Type
Purchase Details
Closed on
Jan 11, 2021
Sold by
Hill James A
Bought by
Drown Robert E and Drown Jessica
Current Estimated Value
Home Financials for this Owner
Home Financials are based on the most recent Mortgage that was taken out on this home.
Original Mortgage
$320,000
Outstanding Balance
$285,551
Interest Rate
2.7%
Mortgage Type
Purchase Money Mortgage
Estimated Equity
$664,693
Purchase Details
Closed on
May 7, 1968
Bought by
Hill James A and Hill Carol A
Create a Home Valuation Report for This Property
The Home Valuation Report is an in-depth analysis detailing your home's value as well as a comparison with similar homes in the area
Home Values in the Area
Average Home Value in this Area
Purchase History
| Date | Buyer | Sale Price | Title Company |
|---|---|---|---|
| Drown Robert E | $320,000 | None Available | |
| Hill James A | -- | -- |
Source: Public Records
Mortgage History
| Date | Status | Borrower | Loan Amount |
|---|---|---|---|
| Open | Drown Robert E | $320,000 | |
| Previous Owner | Hill James A | $30,000 | |
| Previous Owner | Hill James A | $30,000 |
Source: Public Records
Tax History Compared to Growth
Tax History
| Year | Tax Paid | Tax Assessment Tax Assessment Total Assessment is a certain percentage of the fair market value that is determined by local assessors to be the total taxable value of land and additions on the property. | Land | Improvement |
|---|---|---|---|---|
| 2025 | $9,508 | $791,000 | $309,000 | $482,000 |
| 2024 | $9,433 | $784,100 | $303,800 | $480,300 |
| 2023 | $7,442 | $585,100 | $289,000 | $296,100 |
| 2022 | $7,102 | $501,900 | $238,000 | $263,900 |
| 2021 | $6,711 | $460,300 | $222,800 | $237,500 |
| 2020 | $5,519 | $380,900 | $218,000 | $162,900 |
| 2019 | $4,611 | $367,800 | $212,600 | $155,200 |
| 2018 | $5,198 | $349,100 | $212,600 | $136,500 |
| 2017 | $5,072 | $335,900 | $202,600 | $133,300 |
| 2016 | $4,921 | $322,500 | $187,800 | $134,700 |
| 2015 | $4,625 | $313,800 | $177,800 | $136,000 |
Source: Public Records
Map
Nearby Homes
- 78 Old Cart Path Ln Unit Lot 3
- 26 Pierce Dr
- 30 Old Washington St Unit 9
- 249 High St
- 192 Taylor St
- 20 Acorn Ln
- 593 Washington St Unit A
- 27 Chestnut Rd
- 234 Forest St
- 547 Washington St Unit A10
- 110 Keene St
- 40 Fairwood Dr
- 523 Washington St Unit C6
- 15 Bagnell Dr Unit 15
- 53 Grove St
- 18 Allen St
- 345 Forest St
- 20 Edward Dr
- 33 Barker Square Dr Unit 33
- 202 Birch St