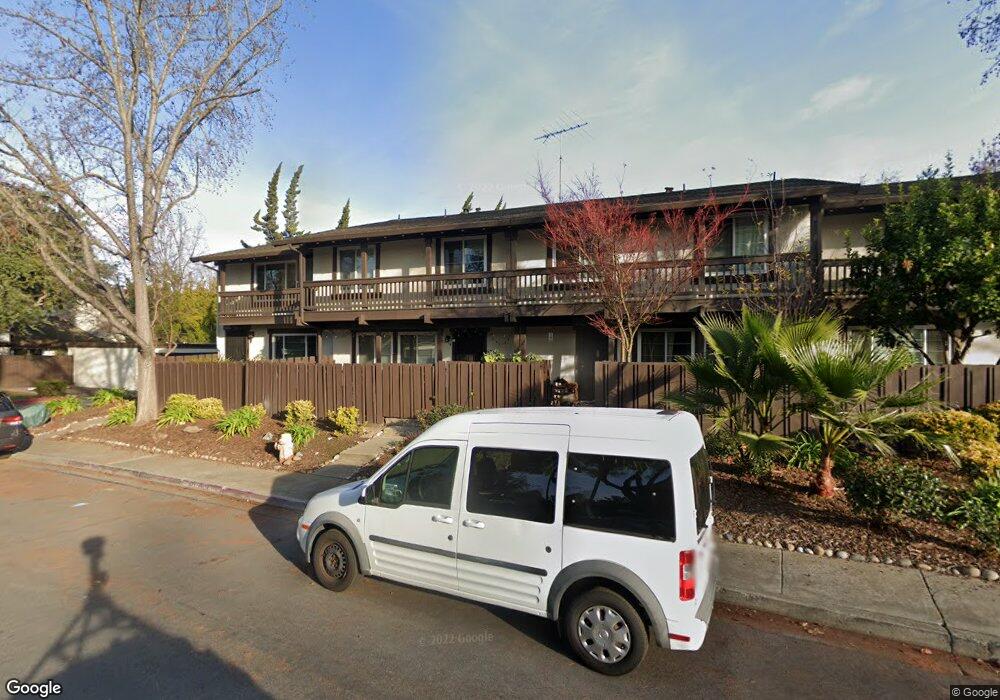
279 Junipero Common Fremont, CA 94536
Niles NeighborhoodEstimated Value: $940,000 - $1,197,000
4
Beds
3
Baths
1,624
Sq Ft
$637/Sq Ft
Est. Value
About This Home
This home is located at 279 Junipero Common, Fremont, CA 94536 and is currently estimated at $1,034,018, approximately $636 per square foot. 279 Junipero Common is a home located in Alameda County with nearby schools including Niles Elementary School, Centerville Junior High School, and Washington High School.
Ownership History
Date
Name
Owned For
Owner Type
Purchase Details
Closed on
Jul 8, 2015
Sold by
Banuelos Steven and The Judith Banuelos Trust
Bought by
Vanzara Urvish P and Vanzara Bhakti U
Current Estimated Value
Home Financials for this Owner
Home Financials are based on the most recent Mortgage that was taken out on this home.
Original Mortgage
$520,000
Outstanding Balance
$400,295
Interest Rate
3.5%
Mortgage Type
Adjustable Rate Mortgage/ARM
Estimated Equity
$633,723
Purchase Details
Closed on
Apr 11, 2005
Sold by
Banuelos Judith K
Bought by
Banuelos Judith K and The Judith Banuelos Trust
Purchase Details
Closed on
Jan 8, 2005
Sold by
Banuelos Judith K
Bought by
Banuelos Judith K
Purchase Details
Closed on
Mar 23, 1999
Sold by
Banuelos Emilio A and Banuelos Judith K
Bought by
Banuelos Emilio and Banuelos Judith
Home Financials for this Owner
Home Financials are based on the most recent Mortgage that was taken out on this home.
Original Mortgage
$158,700
Interest Rate
6.79%
Create a Home Valuation Report for This Property
The Home Valuation Report is an in-depth analysis detailing your home's value as well as a comparison with similar homes in the area
Home Values in the Area
Average Home Value in this Area
Purchase History
| Date | Buyer | Sale Price | Title Company |
|---|---|---|---|
| Vanzara Urvish P | $650,000 | Fidelity National Title Co | |
| Banuelos Judith K | -- | -- | |
| Banuelos Judith K | -- | -- | |
| Banuelos Emilio | -- | Commonwealth Land Title Co |
Source: Public Records
Mortgage History
| Date | Status | Borrower | Loan Amount |
|---|---|---|---|
| Open | Vanzara Urvish P | $520,000 | |
| Previous Owner | Banuelos Emilio | $158,700 |
Source: Public Records
Tax History
| Year | Tax Paid | Tax Assessment Tax Assessment Total Assessment is a certain percentage of the fair market value that is determined by local assessors to be the total taxable value of land and additions on the property. | Land | Improvement |
|---|---|---|---|---|
| 2025 | $9,215 | $762,450 | $230,835 | $538,615 |
| 2024 | $9,215 | $747,363 | $226,309 | $528,054 |
| 2023 | $8,968 | $739,575 | $221,872 | $517,703 |
| 2022 | $8,852 | $718,074 | $217,522 | $507,552 |
| 2021 | $8,640 | $703,858 | $213,257 | $497,601 |
| 2020 | $8,654 | $703,572 | $211,071 | $492,501 |
| 2019 | $8,555 | $689,780 | $206,934 | $482,846 |
| 2018 | $8,387 | $676,260 | $202,878 | $473,382 |
| 2017 | $8,177 | $663,000 | $198,900 | $464,100 |
| 2016 | $8,119 | $650,000 | $195,000 | $455,000 |
| 2015 | $3,542 | $266,710 | $80,056 | $186,654 |
| 2014 | $3,481 | $261,486 | $78,488 | $182,998 |
Source: Public Records
Map
Nearby Homes
- 447 Vega Terrace
- 36341 Mission Blvd
- 310 Grau Dr
- 35968 Killorglin Common
- 77 Barnes Ln
- 36930 Niles Blvd
- 35849 Carnation Way
- 357 Sunnyslope Dr
- 37230 2nd St
- 35100 King Ct
- 339 I St
- 217 Appian Way
- 165 Aurora Plaza
- 351 Riviera Dr
- 213 Ladera Plaza Unit 13
- 2655 Barrington Terrace
- 35686 Chaplin Dr
- 159 Quiancy Terrance
- 37915 Vallejo St
- 231 Famoso Plaza
- 283 Junipero Common
- 277 Junipero Common
- 285 Junipero Common
- 291 Le Pomar Terrace
- 281 Le Pomar Terrace
- 271 Le Pomar Terrace
- 300 Paloma Terrace
- 280 Junipero Common
- 282 Junipero Common
- 261 Le Pomar Terrace
- 284 Junipero Common
- 296 Junipero Common
- 251 Le Pomar Terrace
- 294 Junipero Common
- 310 Paloma Terrace
- 301 Paloma Terrace
- 241 Le Pomar Terrace
- 292 Junipero Common
- 311 Paloma Terrace
- 320 Paloma Terrace
Your Personal Tour Guide
Ask me questions while you tour the home.