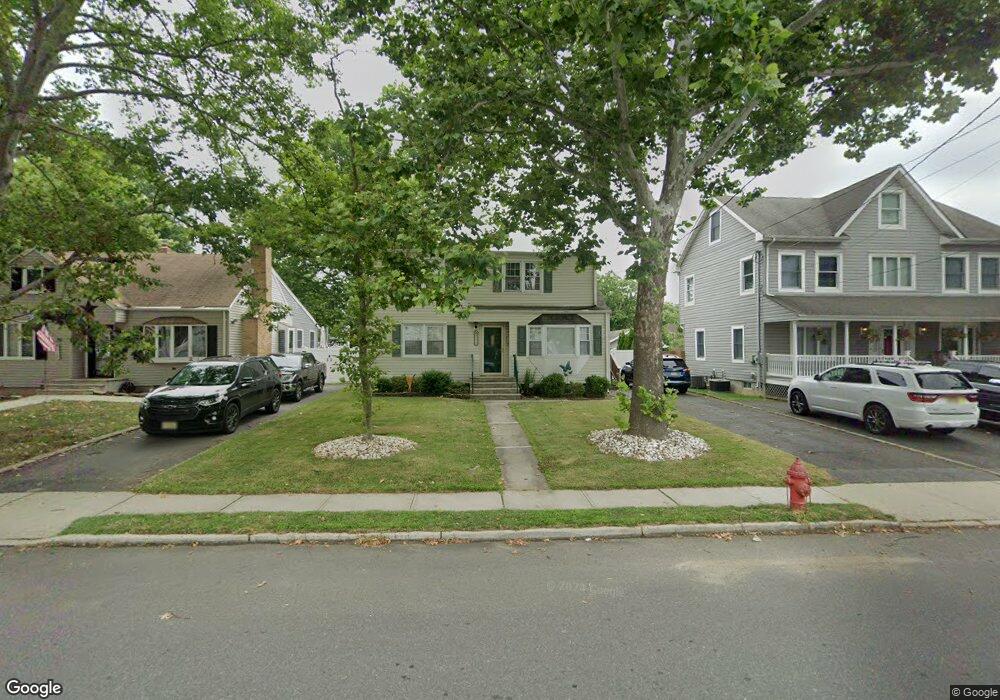
279 Main St Keyport, NJ 07735
Estimated Value: $516,941 - $602,000
3
Beds
2
Baths
1,571
Sq Ft
$363/Sq Ft
Est. Value
About This Home
This home is located at 279 Main St, Keyport, NJ 07735 and is currently estimated at $569,735, approximately $362 per square foot. 279 Main St is a home located in Monmouth County with nearby schools including Keyport Central School, Keyport High School, and Icob Academy.
Ownership History
Date
Name
Owned For
Owner Type
Purchase Details
Closed on
Apr 29, 2013
Sold by
Ashmore Daniel M and Ashmore Stacy
Bought by
Magda John D and Tota Caroline E
Current Estimated Value
Home Financials for this Owner
Home Financials are based on the most recent Mortgage that was taken out on this home.
Original Mortgage
$252,345
Interest Rate
4.42%
Mortgage Type
FHA
Purchase Details
Closed on
Nov 30, 1999
Sold by
Walsh Thomas
Bought by
Ashmore Daniel
Home Financials for this Owner
Home Financials are based on the most recent Mortgage that was taken out on this home.
Original Mortgage
$106,340
Interest Rate
7.86%
Mortgage Type
FHA
Create a Home Valuation Report for This Property
The Home Valuation Report is an in-depth analysis detailing your home's value as well as a comparison with similar homes in the area
Home Values in the Area
Average Home Value in this Area
Purchase History
| Date | Buyer | Sale Price | Title Company |
|---|---|---|---|
| Magda John D | $267,000 | None Available | |
| Ashmore Daniel | $134,000 | -- |
Source: Public Records
Mortgage History
| Date | Status | Borrower | Loan Amount |
|---|---|---|---|
| Previous Owner | Magda John D | $252,345 | |
| Previous Owner | Ashmore Daniel | $106,340 |
Source: Public Records
Tax History Compared to Growth
Tax History
| Year | Tax Paid | Tax Assessment Tax Assessment Total Assessment is a certain percentage of the fair market value that is determined by local assessors to be the total taxable value of land and additions on the property. | Land | Improvement |
|---|---|---|---|---|
| 2025 | $7,868 | $402,200 | $194,600 | $207,600 |
| 2024 | $7,763 | $380,100 | $182,700 | $197,400 |
| 2023 | $7,763 | $353,200 | $166,100 | $187,100 |
| 2022 | $6,578 | $307,000 | $144,400 | $162,600 |
| 2021 | $6,578 | $260,600 | $128,900 | $131,700 |
| 2020 | $6,337 | $249,200 | $124,000 | $125,200 |
| 2019 | $6,137 | $241,700 | $119,300 | $122,400 |
| 2018 | $5,728 | $220,300 | $105,800 | $114,500 |
| 2017 | $5,668 | $217,400 | $105,800 | $111,600 |
| 2016 | $5,268 | $203,800 | $105,800 | $98,000 |
| 2015 | $5,259 | $202,500 | $105,800 | $96,700 |
| 2014 | $5,466 | $212,500 | $96,800 | $115,700 |
Source: Public Records
Map
Nearby Homes
- 9 Monmouth Place
- 90 Saint Peters Place
- 231 Atlantic St Unit 23
- 195 Atlantic St
- 25-27 Brook Ave
- 226 Osborn St
- 47 Village Green Way
- 118 Village Green Way
- 72 Manchester Ave
- 74 Manchester Ave
- 127 Chingarora Ave
- 2108 Florence Ave
- 54 Chingarora Ave
- 40 Church St
- 253 Broadway
- 8 Chingarora Ave
- 95 Broadway
- 55 E Front St
- 128 1st St
- 162 2nd St