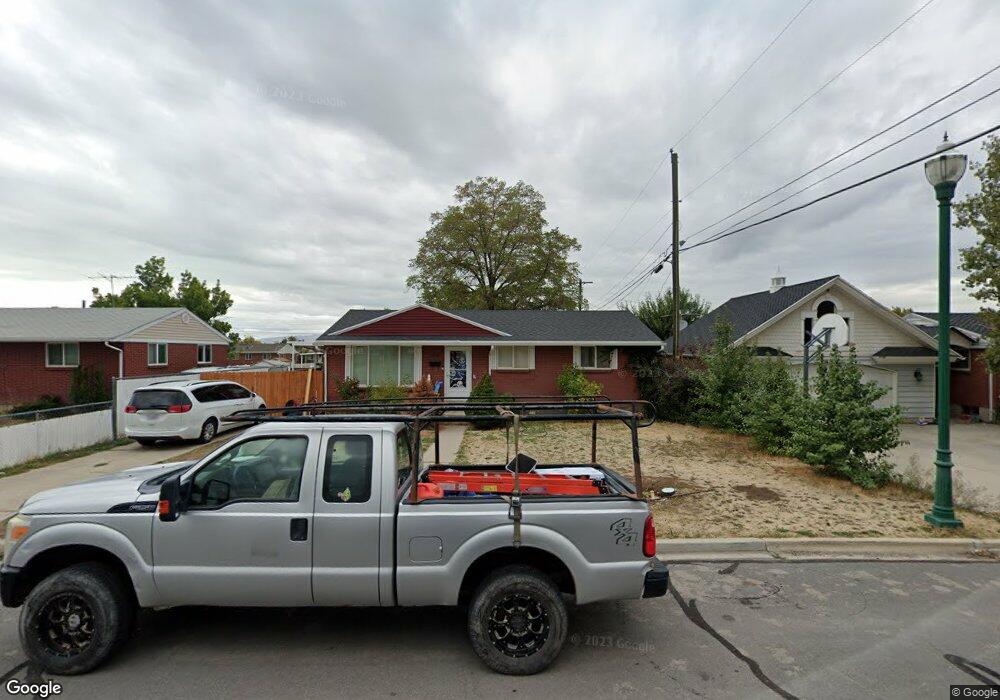
279 N 300 E Orem, UT 84057
Sharon NeighborhoodEstimated Value: $477,000 - $501,000
5
Beds
2
Baths
2,050
Sq Ft
$239/Sq Ft
Est. Value
About This Home
This home is located at 279 N 300 E, Orem, UT 84057 and is currently estimated at $490,581, approximately $239 per square foot. 279 N 300 E is a home located in Utah County with nearby schools including Cascade Elementary School, Canyon View Junior High School, and Orem High School.
Ownership History
Date
Name
Owned For
Owner Type
Purchase Details
Closed on
Feb 6, 2019
Sold by
Whiting Scott E and Whiting Cynthia A
Bought by
Mason Julane
Current Estimated Value
Purchase Details
Closed on
Jan 9, 2012
Sold by
Whiting Scott E and Whiting Cynthia A
Bought by
Whiting Scott E and Whiting Cynthia A
Home Financials for this Owner
Home Financials are based on the most recent Mortgage that was taken out on this home.
Original Mortgage
$144,000
Interest Rate
3.91%
Mortgage Type
New Conventional
Purchase Details
Closed on
Aug 1, 2006
Sold by
Smith Alan B and Smith Kimberly D
Bought by
Whiting Scott E and Whiting Cynthia A
Create a Home Valuation Report for This Property
The Home Valuation Report is an in-depth analysis detailing your home's value as well as a comparison with similar homes in the area
Home Values in the Area
Average Home Value in this Area
Purchase History
| Date | Buyer | Sale Price | Title Company |
|---|---|---|---|
| Mason Julane | -- | Utah First Title Ins Agency | |
| Whiting Scott E | -- | Accommodation | |
| Whiting Scott E | -- | First American Title Agency |
Source: Public Records
Mortgage History
| Date | Status | Borrower | Loan Amount |
|---|---|---|---|
| Previous Owner | Whiting Scott E | $144,000 |
Source: Public Records
Tax History
| Year | Tax Paid | Tax Assessment Tax Assessment Total Assessment is a certain percentage of the fair market value that is determined by local assessors to be the total taxable value of land and additions on the property. | Land | Improvement |
|---|---|---|---|---|
| 2025 | $1,938 | $259,820 | -- | -- |
| 2024 | $1,938 | $236,940 | $0 | $0 |
| 2023 | $1,783 | $234,355 | $0 | $0 |
| 2022 | $1,839 | $234,135 | $0 | $0 |
| 2021 | $1,607 | $310,000 | $129,900 | $180,100 |
| 2020 | $1,480 | $280,500 | $103,900 | $176,600 |
| 2019 | $1,186 | $233,700 | $93,300 | $140,400 |
| 2018 | $1,103 | $207,700 | $82,300 | $125,400 |
| 2017 | $1,038 | $104,665 | $0 | $0 |
| 2016 | $927 | $86,240 | $0 | $0 |
| 2015 | $919 | $80,850 | $0 | $0 |
| 2014 | $913 | $79,915 | $0 | $0 |
Source: Public Records
Map
Nearby Homes
Your Personal Tour Guide
Ask me questions while you tour the home.