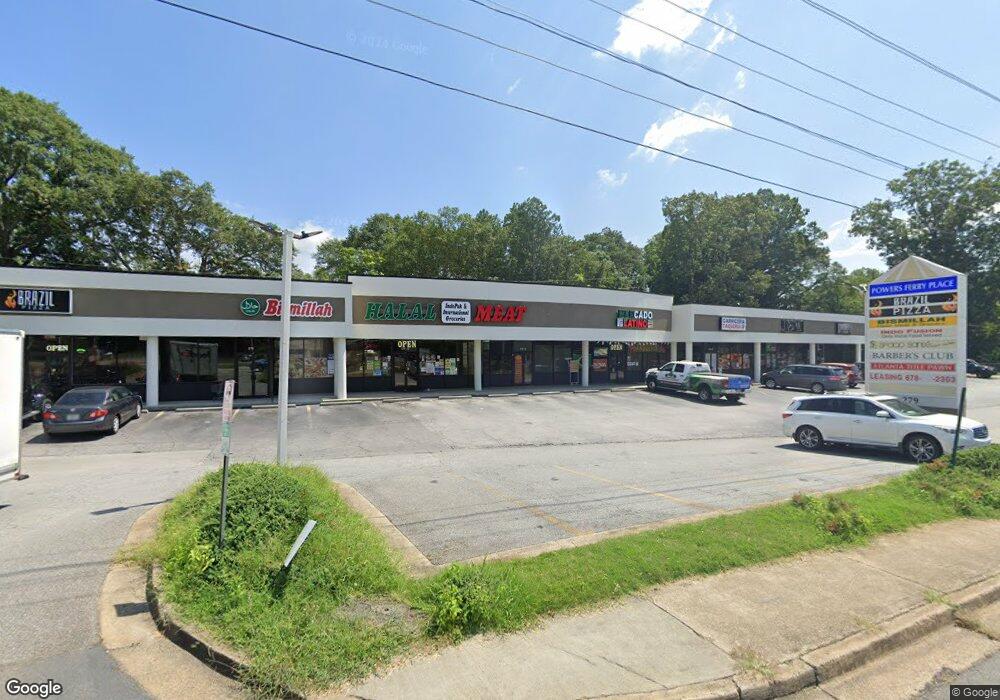
279 Powers Ferry Rd SE Marietta, GA 30067
Estimated Value: $3,566,935
--
Bed
--
Bath
12,752
Sq Ft
$280/Sq Ft
Est. Value
About This Home
This home is located at 279 Powers Ferry Rd SE, Marietta, GA 30067 and is currently estimated at $3,566,935, approximately $279 per square foot. 279 Powers Ferry Rd SE is a home located in Cobb County with nearby schools including Marietta Sixth Grade Academy, Lockheed Elementary School, and Marietta Middle School.
Ownership History
Date
Name
Owned For
Owner Type
Purchase Details
Closed on
May 31, 2024
Sold by
Fahard Investments Llc
Bought by
Powers Ferry Retail Investments Llc
Current Estimated Value
Home Financials for this Owner
Home Financials are based on the most recent Mortgage that was taken out on this home.
Original Mortgage
$2,520,000
Outstanding Balance
$2,293,579
Interest Rate
7.1%
Mortgage Type
New Conventional
Estimated Equity
$1,273,356
Purchase Details
Closed on
Jan 21, 2007
Sold by
Fajardo Teresa
Bought by
Fahard Investments Llc
Purchase Details
Closed on
Jun 27, 1997
Sold by
Garr M A and G & H Center Ltd
Bought by
Goodman Hugh S
Home Financials for this Owner
Home Financials are based on the most recent Mortgage that was taken out on this home.
Original Mortgage
$732,000
Interest Rate
7.98%
Mortgage Type
Commercial
Create a Home Valuation Report for This Property
The Home Valuation Report is an in-depth analysis detailing your home's value as well as a comparison with similar homes in the area
Home Values in the Area
Average Home Value in this Area
Purchase History
| Date | Buyer | Sale Price | Title Company |
|---|---|---|---|
| Powers Ferry Retail Investments Llc | -- | Calloway Title | |
| Powers Ferry Retail Investments Llc | $3,600,000 | Calloway Title | |
| Fahard Investments Llc | -- | -- | |
| Goodman Hugh S | $890,000 | -- |
Source: Public Records
Mortgage History
| Date | Status | Borrower | Loan Amount |
|---|---|---|---|
| Open | Powers Ferry Retail Investments Llc | $2,520,000 | |
| Previous Owner | Goodman Hugh S | $732,000 |
Source: Public Records
Tax History Compared to Growth
Tax History
| Year | Tax Paid | Tax Assessment Tax Assessment Total Assessment is a certain percentage of the fair market value that is determined by local assessors to be the total taxable value of land and additions on the property. | Land | Improvement |
|---|---|---|---|---|
| 2024 | $5,143 | $607,880 | $321,800 | $286,080 |
| 2023 | $5,140 | $607,600 | $321,800 | $285,800 |
| 2022 | $4,616 | $545,620 | $297,036 | $248,584 |
| 2021 | $4,682 | $545,024 | $297,036 | $247,988 |
| 2020 | $4,682 | $545,024 | $297,036 | $247,988 |
| 2019 | $4,464 | $519,636 | $297,036 | $222,600 |
| 2018 | $4,464 | $519,636 | $297,036 | $222,600 |
| 2017 | $3,580 | $519,636 | $297,036 | $222,600 |
| 2016 | $3,135 | $454,952 | $247,552 | $207,400 |
| 2015 | $3,412 | $454,952 | $247,552 | $207,400 |
| 2014 | $3,571 | $460,832 | $247,552 | $213,280 |
Source: Public Records
Map
Nearby Homes
- 349 Virginia Place SE
- 1722 Crestridge Dr SE
- 2059 Clearwater Dr SE
- 1821 Clearwater Dr SE
- 185 Herbert Dr SE
- 402 Terrydale Dr SE
- 1664 Crestridge Dr SE
- 470 Oriole Dr SE
- 2164 Pawnee Dr SE Unit 1
- 57 Sewell Ln
- 3155 Woodberry Ln SE
- 706 Twin Brooks Ct SE
- 229 Mathews Cir SE
- 456 Sybil Ln SE
- 1434 James St SE
- 525 Robin Ln SE
- 306 Augusta Dr SE
- 2310 Old Sewell Rd
- 20 Ashton Woods Dr
- 497 Salem Woods Dr SE
- 316 Yancy Dr SE
- 314 Yancy Dr SE
- 318 Yancy Dr SE
- 318 Yancy Dr SE Unit 318
- 1939 Hamilton Place SE
- 492 Meadowbrook Dr SE
- 1941 Hamilton Place SE
- 312 Yancy Dr SE
- 1931 Hamilton Place SE
- 1933 Hamilton Place SE
- 320 Yancy Dr SE
- 1935 Hamilton Place SE
- 1935 Hamilton Place SE Unit 1935
- 1937 Hamilton Place SE
- 1943 Hamilton Place SE
- 486 Meadowbrook Dr SE
- 322 Yancy Dr SE
- 1945 Hamilton Place SE
- 310 Yancy Dr SE
- 1947 Hamilton Place SE