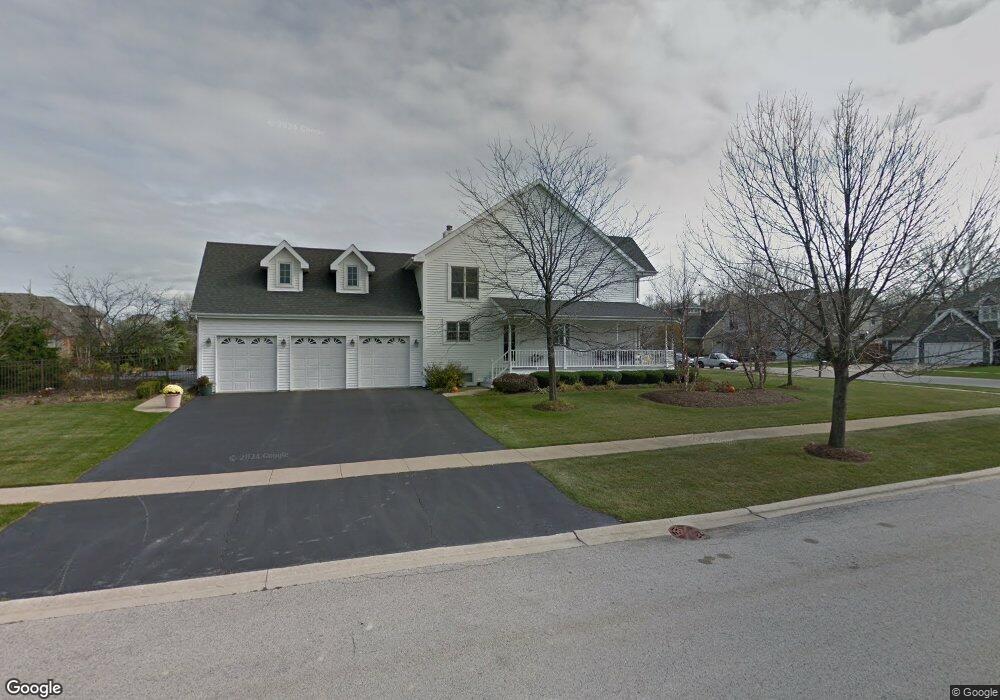
279 Sherlock St Frankfort, IL 60423
North Frankfort NeighborhoodEstimated Value: $819,104 - $948,000
4
Beds
6
Baths
3,779
Sq Ft
$238/Sq Ft
Est. Value
About This Home
This home is located at 279 Sherlock St, Frankfort, IL 60423 and is currently estimated at $900,776, approximately $238 per square foot. 279 Sherlock St is a home located in Will County with nearby schools including Grand Prairie Elementary School, Chelsea Intermediate School, and Hickory Creek Middle School.
Ownership History
Date
Name
Owned For
Owner Type
Purchase Details
Closed on
Jun 28, 2017
Sold by
Stachler Kenneth J and Stachler Susan M
Bought by
Stachler Kenneth J and Stachler Susan M
Current Estimated Value
Purchase Details
Closed on
Feb 6, 2006
Sold by
Capito Anthony C and Capito Beverly L
Bought by
Stachler Kenneth J and Stachler Susan M
Home Financials for this Owner
Home Financials are based on the most recent Mortgage that was taken out on this home.
Original Mortgage
$390,000
Outstanding Balance
$219,555
Interest Rate
6.2%
Mortgage Type
Fannie Mae Freddie Mac
Estimated Equity
$681,221
Purchase Details
Closed on
May 7, 2001
Sold by
Capito Anthony C and Capito Beverly L
Bought by
Capito Anthony C and Capito Beverly L
Purchase Details
Closed on
Sep 19, 1996
Sold by
First National Bank Of Joliet
Bought by
Capito Anthony C and Capito Beverly L
Create a Home Valuation Report for This Property
The Home Valuation Report is an in-depth analysis detailing your home's value as well as a comparison with similar homes in the area
Home Values in the Area
Average Home Value in this Area
Purchase History
| Date | Buyer | Sale Price | Title Company |
|---|---|---|---|
| Stachler Kenneth J | -- | Attorney | |
| Stachler Kenneth J | $637,500 | Chicago Title Insurance Comp | |
| Capito Anthony C | -- | Chicago Title Insurance Co | |
| Capito Anthony C | $85,000 | -- |
Source: Public Records
Mortgage History
| Date | Status | Borrower | Loan Amount |
|---|---|---|---|
| Open | Stachler Kenneth J | $390,000 |
Source: Public Records
Tax History
| Year | Tax Paid | Tax Assessment Tax Assessment Total Assessment is a certain percentage of the fair market value that is determined by local assessors to be the total taxable value of land and additions on the property. | Land | Improvement |
|---|---|---|---|---|
| 2024 | $20,744 | $269,817 | $42,723 | $227,094 |
| 2023 | $20,744 | $240,973 | $38,156 | $202,817 |
| 2022 | $18,118 | $219,486 | $34,754 | $184,732 |
| 2021 | $17,107 | $205,338 | $32,514 | $172,824 |
| 2020 | $16,693 | $199,551 | $31,598 | $167,953 |
| 2019 | $16,166 | $194,210 | $30,752 | $163,458 |
| 2018 | $15,890 | $188,627 | $29,868 | $158,759 |
| 2017 | $15,887 | $184,224 | $29,171 | $155,053 |
| 2016 | $15,527 | $177,908 | $28,171 | $149,737 |
| 2015 | $13,865 | $171,643 | $27,179 | $144,464 |
| 2014 | $13,865 | $170,450 | $26,990 | $143,460 |
| 2013 | $13,865 | $172,660 | $27,340 | $145,320 |
Source: Public Records
Map
Nearby Homes
- 239 Oregon St
- 51 Kaffel Ct
- 9736 Folkers Dr
- 254 Willow St
- 9724 Folkers Dr
- 9730 Folkers Dr
- 21629 Kent Ct
- 111 Oak St
- Lot 3 Town Center Dr
- 21726 Higley Ln
- 647 Johnson Ave
- 425 Cottonwood Rd
- 120 W Sauk Trail
- 456 Ohio Rd
- 21213 S 93rd Ave
- 10039 Croft Ln
- 376 Nevada a Ct
- 719 Stonebridge Rd
- 9155 Arbour Walk Dr
- 9306 Fox Run Cir
- 267 Sherlock St
- 9935 Folkers Dr
- 301 Sherlock St
- 255 Sherlock St
- 21446 Murphy Cir
- 278 Sherlock St
- 290 Sherlock St
- 266 Sherlock St
- 313 Sherlock St
- 243 Sherlock St
- 9940 Folkers Dr
- 302 Sherlock St
- 302 Sherlock St
- 254 Sherlock St
- 9946 Folkers Dr
- 9946 Folkers Dr Unit 9946
- 9940 Folkers Dr Unit 9940
- 9940 Folkers Dr Unit 1D
- 9940 Folkers Dr Unit 1B-G
- 9934 Folkers Dr
Your Personal Tour Guide
Ask me questions while you tour the home.