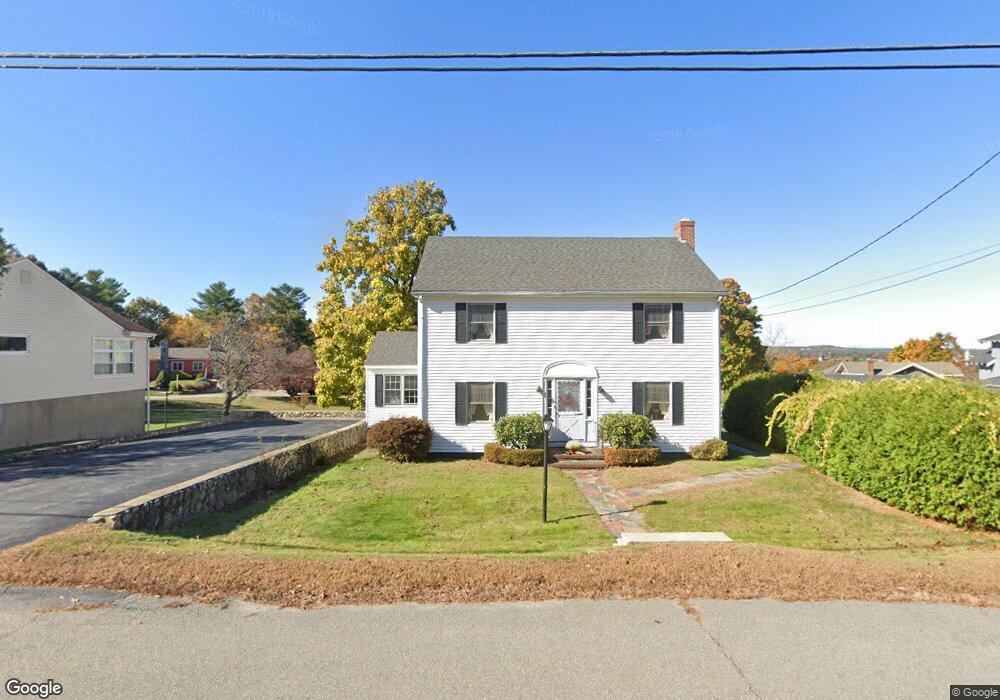
279 Wilson St Clinton, MA 01510
Estimated Value: $398,000 - $479,000
3
Beds
2
Baths
1,686
Sq Ft
$267/Sq Ft
Est. Value
About This Home
This home is located at 279 Wilson St, Clinton, MA 01510 and is currently estimated at $449,547, approximately $266 per square foot. 279 Wilson St is a home located in Worcester County with nearby schools including Clinton Elementary School, Clinton Senior High School, and Clinton Middle School.
Ownership History
Date
Name
Owned For
Owner Type
Purchase Details
Closed on
Jul 31, 2020
Sold by
High Maureen and Learned Diane
Bought by
Bosselman Michael and Bosselman Cindy
Current Estimated Value
Home Financials for this Owner
Home Financials are based on the most recent Mortgage that was taken out on this home.
Original Mortgage
$192,000
Outstanding Balance
$170,632
Interest Rate
3.1%
Mortgage Type
New Conventional
Estimated Equity
$278,915
Create a Home Valuation Report for This Property
The Home Valuation Report is an in-depth analysis detailing your home's value as well as a comparison with similar homes in the area
Home Values in the Area
Average Home Value in this Area
Purchase History
| Date | Buyer | Sale Price | Title Company |
|---|---|---|---|
| Bosselman Michael | $240,000 | None Available |
Source: Public Records
Mortgage History
| Date | Status | Borrower | Loan Amount |
|---|---|---|---|
| Open | Bosselman Michael | $192,000 |
Source: Public Records
Tax History Compared to Growth
Tax History
| Year | Tax Paid | Tax Assessment Tax Assessment Total Assessment is a certain percentage of the fair market value that is determined by local assessors to be the total taxable value of land and additions on the property. | Land | Improvement |
|---|---|---|---|---|
| 2025 | $4,898 | $368,300 | $112,600 | $255,700 |
| 2024 | $4,708 | $358,300 | $112,600 | $245,700 |
| 2023 | $4,297 | $321,400 | $102,400 | $219,000 |
| 2022 | $4,215 | $282,700 | $93,000 | $189,700 |
| 2021 | $3,826 | $240,000 | $88,600 | $151,400 |
| 2020 | $3,718 | $240,000 | $88,600 | $151,400 |
| 2019 | $3,713 | $233,100 | $86,000 | $147,100 |
| 2018 | $3,715 | $218,800 | $86,000 | $132,800 |
| 2017 | $3,417 | $193,400 | $86,000 | $107,400 |
| 2016 | $3,383 | $195,900 | $86,000 | $109,900 |
| 2015 | $3,002 | $180,200 | $83,500 | $96,700 |
| 2014 | $2,910 | $180,200 | $83,500 | $96,700 |
Source: Public Records
Map
Nearby Homes
- 66 Oak St Unit 66
- 70 Oak St Unit 70
- 109 Oak St
- 286 Grove St Unit 286
- 40 Nashua St Unit 5
- 125 Grove St
- 11 Lindbergh Street Rear
- 180 Beacon St
- 37 Grove St Unit 37
- 160 Park St
- 13 Simon Ct
- 28 Lindbergh St
- 19 Candice St
- 118 Chace St
- 346 Oak St
- 38 Norman St
- 445 Berlin St Unit 1
- 1221 Hazelwood Way Unit 1221
- 38 Lane Ave Unit B
- 403 Main St