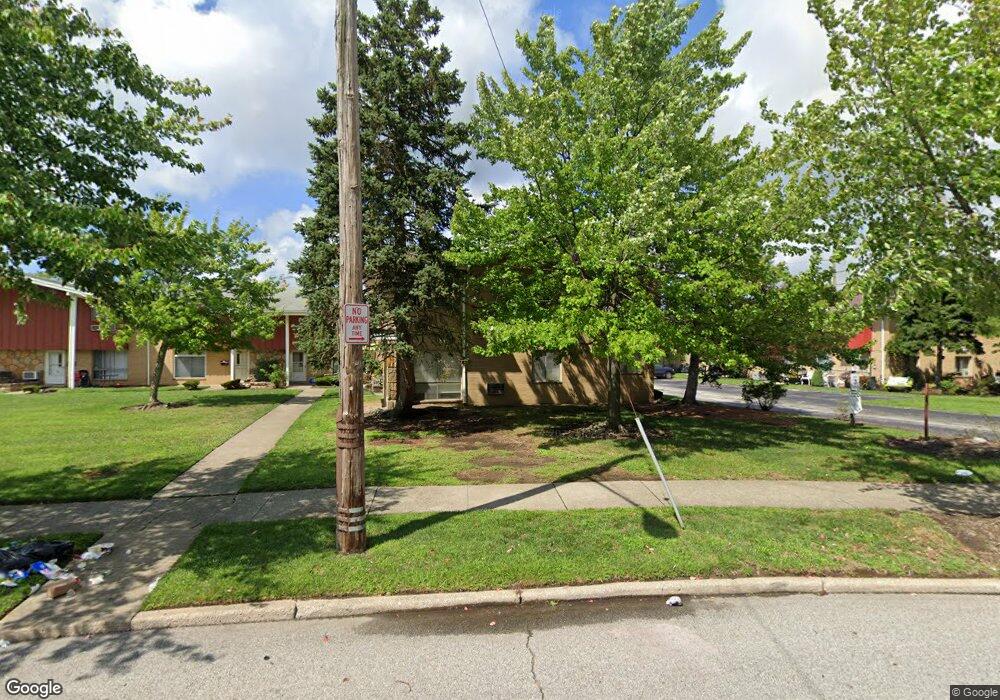
27901 Mills Ave Euclid, OH 44132
Estimated Value: $73,812 - $77,000
3
Beds
2
Baths
1,364
Sq Ft
$56/Sq Ft
Est. Value
About This Home
This home is located at 27901 Mills Ave, Euclid, OH 44132 and is currently estimated at $75,703, approximately $55 per square foot. 27901 Mills Ave is a home located in Cuyahoga County with nearby schools including Bluestone Elementary School, Euclid High School, and All Saints of St. John Vianney School.
Ownership History
Date
Name
Owned For
Owner Type
Purchase Details
Closed on
Oct 2, 2024
Sold by
Mastiff Llc
Bought by
Vertex Investment Llc
Current Estimated Value
Purchase Details
Closed on
May 18, 2021
Sold by
Lawson Daryl and Lawson Jade
Bought by
Mastiff Llc
Purchase Details
Closed on
Jun 5, 2014
Sold by
Barkari Nuru and Barkari Zalika
Bought by
Lawson Daryl
Purchase Details
Closed on
May 18, 2004
Sold by
Barkari Nuru and Barkari Zalika
Bought by
Barkari Nuru and Barkari Zalika
Home Financials for this Owner
Home Financials are based on the most recent Mortgage that was taken out on this home.
Original Mortgage
$38,500
Interest Rate
9.12%
Mortgage Type
Unknown
Purchase Details
Closed on
Aug 20, 1979
Sold by
Keal Irene A
Bought by
Jones Lorenzo
Purchase Details
Closed on
Jan 1, 1975
Bought by
Keal Irene A
Create a Home Valuation Report for This Property
The Home Valuation Report is an in-depth analysis detailing your home's value as well as a comparison with similar homes in the area
Home Values in the Area
Average Home Value in this Area
Purchase History
| Date | Buyer | Sale Price | Title Company |
|---|---|---|---|
| Vertex Investment Llc | $76,000 | Ohio Real Title | |
| Mastiff Llc | $45,000 | Ohio Real Title | |
| Lawson Daryl | $17,500 | Barristers Title Agency | |
| Barkari Nuru | -- | Patriot Land Title | |
| Jones Lorenzo | $33,000 | -- | |
| Keal Irene A | -- | -- |
Source: Public Records
Mortgage History
| Date | Status | Borrower | Loan Amount |
|---|---|---|---|
| Previous Owner | Barkari Nuru | $38,500 |
Source: Public Records
Tax History Compared to Growth
Tax History
| Year | Tax Paid | Tax Assessment Tax Assessment Total Assessment is a certain percentage of the fair market value that is determined by local assessors to be the total taxable value of land and additions on the property. | Land | Improvement |
|---|---|---|---|---|
| 2024 | $1,195 | $15,750 | $2,380 | $13,370 |
| 2023 | $1,246 | $13,230 | $1,330 | $11,900 |
| 2022 | $1,220 | $13,230 | $1,330 | $11,900 |
| 2021 | $1,348 | $13,230 | $1,330 | $11,900 |
| 2020 | $1,082 | $9,380 | $950 | $8,440 |
| 2019 | $948 | $26,800 | $2,700 | $24,100 |
| 2018 | $991 | $9,380 | $950 | $8,440 |
| 2017 | $1,091 | $9,070 | $910 | $8,160 |
| 2016 | $1,093 | $9,070 | $910 | $8,160 |
| 2015 | $1,892 | $9,070 | $910 | $8,160 |
| 2014 | $1,892 | $18,130 | $1,820 | $16,310 |
Source: Public Records
Map
Nearby Homes
- 1333 Craneing Rd
- 26982 Tungsten Rd
- 28030 Coolidge Dr
- 1670 Hillandale Dr
- 26268 Leslie Ave
- 780 E 266th St
- 755 E 266th St
- 28900 Euclid Ave
- 825 E 256th St
- 712 E 266th St
- 670 Hemlock Dr
- 28886 Hazel Ave
- 754 E 256th St
- 635 E 261st St
- 630 Birch Ave
- 640 E 261st St
- 26471 Farringdon Ave
- 25530 Richards Ave
- 25700 Briardale Ave
- 27190 Shoreview Ave
- 27901 Mills Ave
- 27901 Mills Ave
- 27901 Mills Ave
- 27901 Mills Ave Unit 1
- 27901 Mills Ave
- 27901 Mills Ave
- 27901 Mills Ave
- 27901 Mills Ave
- 27901 Mills Ave
- 27901 Mills Ave
- 27901 Mills Ave Unit 1K
- 27901 Mills Ave Unit 1B
- 1251 E 279th St
- 1251 E 279th St
- 1251 E 279th St
- 1251 E 279th St Unit Beautiful 3Bed/2Bath
- 1251 E 279th St Unit E
- 1251 E 279th St Unit 2D
- 1251 E 279th St Unit 2F
- 27801 Mills Ave Unit 3K