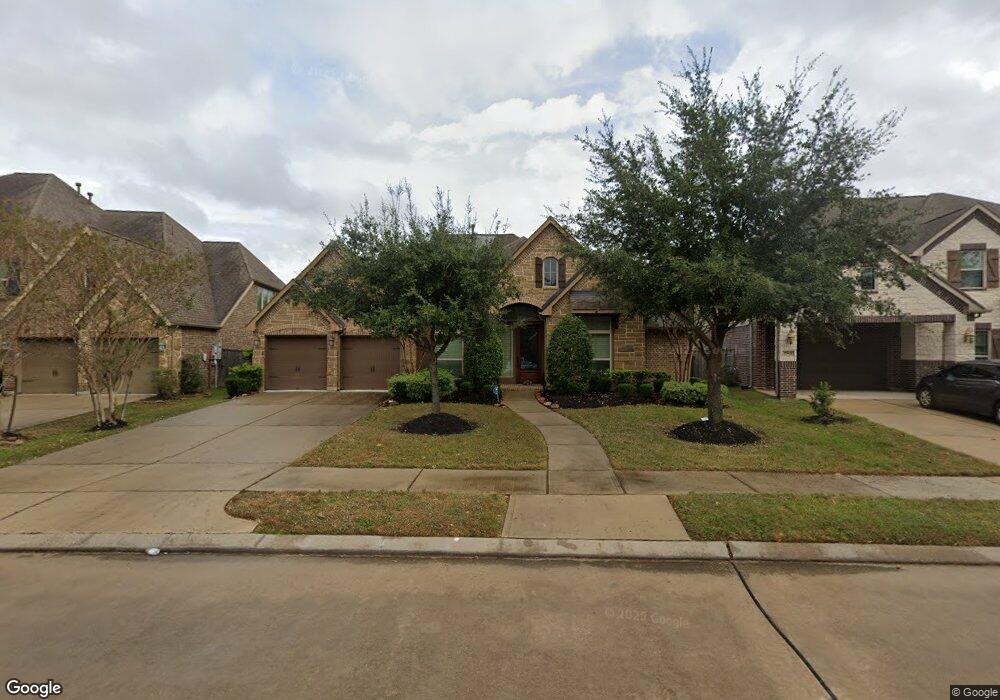
27906 Bandera Glen Ln Katy, TX 77494
Southwest Cinco Ranch NeighborhoodEstimated Value: $700,994 - $807,000
4
Beds
4
Baths
3,492
Sq Ft
$211/Sq Ft
Est. Value
About This Home
This home is located at 27906 Bandera Glen Ln, Katy, TX 77494 and is currently estimated at $736,499, approximately $210 per square foot. 27906 Bandera Glen Ln is a home located in Fort Bend County with nearby schools including Jenks Elementary School, Joe M. Adams Junior High, and Sugar Creek Montessori - Fulshear/West Katy.
Ownership History
Date
Name
Owned For
Owner Type
Purchase Details
Closed on
Aug 18, 2015
Sold by
Boyd Molly Sue
Bought by
Amer Ahmed S
Current Estimated Value
Home Financials for this Owner
Home Financials are based on the most recent Mortgage that was taken out on this home.
Original Mortgage
$389,600
Outstanding Balance
$299,370
Interest Rate
3.37%
Mortgage Type
Adjustable Rate Mortgage/ARM
Estimated Equity
$437,129
Purchase Details
Closed on
Jul 31, 2013
Sold by
Perry Homes Llc
Bought by
Boyd Molly Sue
Home Financials for this Owner
Home Financials are based on the most recent Mortgage that was taken out on this home.
Original Mortgage
$365,287
Interest Rate
3.93%
Mortgage Type
New Conventional
Purchase Details
Closed on
Apr 23, 2013
Sold by
Nash Cinco Nw Llc
Bought by
Perry Homes Llc
Create a Home Valuation Report for This Property
The Home Valuation Report is an in-depth analysis detailing your home's value as well as a comparison with similar homes in the area
Home Values in the Area
Average Home Value in this Area
Purchase History
| Date | Buyer | Sale Price | Title Company |
|---|---|---|---|
| Amer Ahmed S | -- | Tradition Title Co | |
| Boyd Molly Sue | -- | None Available | |
| Amer Ahmed S | -- | -- | |
| Perry Homes Llc | -- | Chicago Title | |
| Amer Ahmed S | -- | -- |
Source: Public Records
Mortgage History
| Date | Status | Borrower | Loan Amount |
|---|---|---|---|
| Open | Amer Ahmed S | $389,600 | |
| Previous Owner | Amer Ahmed S | $365,287 |
Source: Public Records
Tax History Compared to Growth
Tax History
| Year | Tax Paid | Tax Assessment Tax Assessment Total Assessment is a certain percentage of the fair market value that is determined by local assessors to be the total taxable value of land and additions on the property. | Land | Improvement |
|---|---|---|---|---|
| 2025 | $8,296 | $677,266 | $118,755 | $592,685 |
| 2024 | $8,296 | $615,696 | $2,509 | $613,187 |
| 2023 | $11,944 | $559,724 | $0 | $590,887 |
| 2022 | $12,511 | $508,840 | $49,870 | $458,970 |
| 2021 | $12,742 | $462,580 | $91,350 | $371,230 |
| 2020 | $13,280 | $467,270 | $91,350 | $375,920 |
| 2019 | $13,785 | $454,850 | $91,350 | $363,500 |
| 2018 | $14,009 | $451,370 | $91,350 | $360,020 |
| 2017 | $14,666 | $464,330 | $91,350 | $372,980 |
| 2016 | $15,024 | $475,650 | $80,390 | $395,260 |
| 2015 | $9,139 | $435,050 | $80,390 | $354,660 |
| 2014 | $8,274 | $390,400 | $80,390 | $310,010 |
Source: Public Records
Map
Nearby Homes
- 27803 Indigo Pointe Ln
- 27719 Merchant Hills Ln
- 27615 Brentsprings Run Ln
- 3314 Flint Valley Ln
- 2918 Chapel Rock Ct
- 27834 Hunters Rock Ln
- 27830 Hunters Rock Ln
- 27414 Hollow Pass Ln
- 3014 Brighton Sky Ln
- 27915 Genesis Manor Ln
- 3002 Brighton Sky Ln
- 2710 Indigo Manor Ln
- 2727 Richmond Ridge Ln
- 3438 Cartwright Cliff Ln
- 3422 Walker Falls Ln
- 3523 Shearwater St
- 27611 Fleetwood Bend Ln
- TBD Rose Ln
- 3527 Shearwater St
- 3535 Blue Mockingbird St
- 27902 Bandera Glen Ln
- 27910 Bandera Glen Ln
- 27822 Bandera Glen Ln
- 27802 Tamara Branch Ln
- 27914 Bandera Glen Ln
- 27827 Merchant Hills Ln
- 27823 Merchant Hills Ln
- 27818 Bandera Glen Ln
- 27806 Tamara Branch Ln
- 27803 Indigo Point
- 27918 Bandera Glen Ln
- 27819 Merchant Hills Ln
- 3103 Seminole Peak Ln
- 27803 Tamara Branch Ln
- 27814 Bandera Glen Ln
- 27807 Indigo Pointe Ln
- 27723 Merchant Hills Ln
- 27810 Tamara Branch Ln
- 27807 Tamara Branch Ln
- 27811 Indigo Pointe Ln