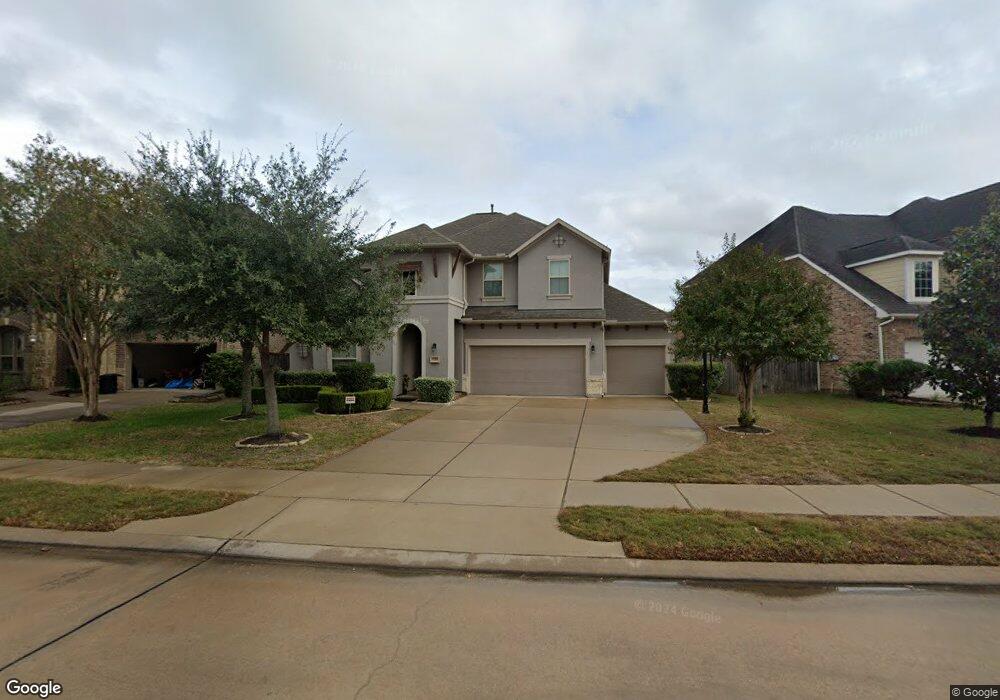
27910 Hunters Rock Ln Katy, TX 77494
Southwest Cinco Ranch NeighborhoodEstimated Value: $583,000 - $649,000
5
Beds
5
Baths
3,412
Sq Ft
$177/Sq Ft
Est. Value
About This Home
This home is located at 27910 Hunters Rock Ln, Katy, TX 77494 and is currently estimated at $603,175, approximately $176 per square foot. 27910 Hunters Rock Ln is a home with nearby schools including Jenks Elementary School, Joe M. Adams Junior High, and Sugar Creek Montessori - Fulshear/West Katy.
Ownership History
Date
Name
Owned For
Owner Type
Purchase Details
Closed on
Jun 1, 2021
Sold by
Abraham Mathew and Singhal Nirupma
Bought by
Abraham Mathew and Singhal Nirupma
Current Estimated Value
Purchase Details
Closed on
Dec 19, 2014
Sold by
Rh Of Texas Lp
Bought by
Abraham Mathew and Singhal Nirupna
Home Financials for this Owner
Home Financials are based on the most recent Mortgage that was taken out on this home.
Original Mortgage
$305,730
Outstanding Balance
$234,962
Interest Rate
4.01%
Mortgage Type
New Conventional
Estimated Equity
$368,213
Purchase Details
Closed on
Mar 31, 2014
Sold by
Nash Cinco Nw Llc
Bought by
Abraham Mathew and Nirupma Singhal
Purchase Details
Closed on
Mar 18, 2014
Sold by
Nash Cinco Nw Llc
Bought by
Rh Of Texas Lp
Purchase Details
Closed on
Jan 29, 2013
Sold by
Nash Cinco Nw Llc
Bought by
Abraham Mathew and Nirupma Singhal
Create a Home Valuation Report for This Property
The Home Valuation Report is an in-depth analysis detailing your home's value as well as a comparison with similar homes in the area
Home Values in the Area
Average Home Value in this Area
Purchase History
| Date | Buyer | Sale Price | Title Company |
|---|---|---|---|
| Abraham Mathew | -- | None Available | |
| Abraham Mathew | -- | Ryland Title Co | |
| Abraham Mathew | -- | -- | |
| Rh Of Texas Lp | -- | Charter Title Co Fort Bend | |
| Abraham Mathew | -- | -- |
Source: Public Records
Mortgage History
| Date | Status | Borrower | Loan Amount |
|---|---|---|---|
| Open | Abraham Mathew | $305,730 |
Source: Public Records
Tax History Compared to Growth
Tax History
| Year | Tax Paid | Tax Assessment Tax Assessment Total Assessment is a certain percentage of the fair market value that is determined by local assessors to be the total taxable value of land and additions on the property. | Land | Improvement |
|---|---|---|---|---|
| 2025 | $10,095 | $564,544 | $81,900 | $502,028 |
| 2024 | $10,095 | $513,222 | -- | $518,407 |
| 2023 | $10,095 | $466,565 | $0 | $513,362 |
| 2022 | $10,021 | $487,120 | $63,000 | $424,120 |
| 2021 | $10,235 | $385,590 | $63,000 | $322,590 |
| 2020 | $10,901 | $397,570 | $63,000 | $334,570 |
| 2019 | $11,081 | $378,100 | $63,000 | $315,100 |
| 2018 | $11,516 | $383,140 | $63,000 | $320,140 |
| 2017 | $11,908 | $389,060 | $63,000 | $326,060 |
| 2016 | $11,367 | $371,410 | $63,000 | $308,410 |
| 2015 | $6,418 | $356,710 | $63,000 | $293,710 |
| 2014 | $788 | $39,000 | $39,000 | $0 |
Source: Public Records
Map
Nearby Homes
- 27834 Hunters Rock Ln
- 27830 Hunters Rock Ln
- 3314 Flint Valley Ln
- 27719 Merchant Hills Ln
- 27803 Indigo Pointe Ln
- 27615 Brentsprings Run Ln
- 3438 Cartwright Cliff Ln
- 3422 Walker Falls Ln
- 2918 Chapel Rock Ct
- 27414 Hollow Pass Ln
- 3523 Shearwater St
- 3527 Shearwater St
- TBD Rose Ln
- 3014 Brighton Sky Ln
- 3535 Blue Mockingbird St
- 27915 Genesis Manor Ln
- 28131 Twin Knolls Ln
- 3002 Brighton Sky Ln
- 3530 Blue Mockingbird St
- 3538 Blue Mockingbird St
- 27914 Hunters Rock Ln
- 27906 Hunters Rock Ln
- 3318 Trace Shadow Ct
- 27918 Hunters Rock Ln
- 3314 Trace Shadow Ct
- 27902 Hunters Rock Ln
- 27923 Hunters Rock Ln
- 3322 Trace Shadow Ct
- 3310 Trace Shadow Ct
- 27922 Hunters Rock Ln
- 27919 Hunters Rock Ln
- 27915 Hunters Rock Ln
- 27927 Hunters Rock Ln
- 3306 Trace Shadow Ct
- 27911 Hunters Rock Ln
- 3326 Trace Shadow Ct
- 27931 Hunters Rock Ln
- 27907 Hunters Rock Ln
- 27926 Hunters Rock Ln
- 3302 Trace Shadow Ct