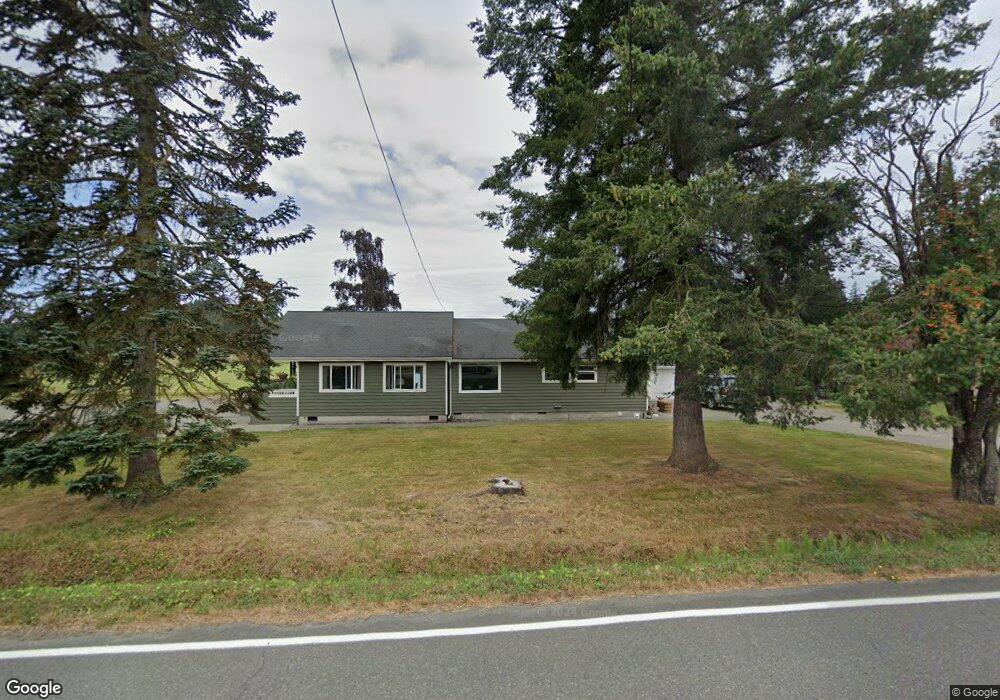
27930 SE 432nd St Enumclaw, WA 98022
Birch - Enumclaw NeighborhoodEstimated Value: $616,000 - $654,000
2
Beds
1
Bath
1,660
Sq Ft
$383/Sq Ft
Est. Value
About This Home
This home is located at 27930 SE 432nd St, Enumclaw, WA 98022 and is currently estimated at $635,917, approximately $383 per square foot. 27930 SE 432nd St is a home located in King County with nearby schools including Byron Kibler Elementary School, Thunder Mountain Middle School, and Enumclaw Senior High School.
Ownership History
Date
Name
Owned For
Owner Type
Purchase Details
Closed on
Nov 18, 2010
Sold by
Ballestrasse David Ryan and Ballestrasse David R
Bought by
Ballestrasse Albert J
Current Estimated Value
Purchase Details
Closed on
Oct 26, 2006
Sold by
Ballestrasse David A and Ballestrasse Patricia
Bought by
Ballestrasse David R
Home Financials for this Owner
Home Financials are based on the most recent Mortgage that was taken out on this home.
Original Mortgage
$384,000
Interest Rate
6.39%
Purchase Details
Closed on
Oct 21, 1997
Sold by
Feris Edward L and Feris Dorothy Mae
Bought by
Ballestrasse Ione
Home Financials for this Owner
Home Financials are based on the most recent Mortgage that was taken out on this home.
Original Mortgage
$162,000
Interest Rate
7%
Purchase Details
Closed on
Dec 24, 1986
Sold by
Ballestrasse Ione
Bought by
Ballestrasse David A and Ballestrasse Patricia
Create a Home Valuation Report for This Property
The Home Valuation Report is an in-depth analysis detailing your home's value as well as a comparison with similar homes in the area
Home Values in the Area
Average Home Value in this Area
Purchase History
| Date | Buyer | Sale Price | Title Company |
|---|---|---|---|
| Ballestrasse Albert J | -- | None Available | |
| Olson Kennet L | -- | None Available | |
| Ballestrasse David R | $480,000 | Fidelity Natio | |
| Ballestrasse Ione | $162,000 | Chicago Title Insurance Co | |
| Ballestrasse David A | $52,000 | -- |
Source: Public Records
Mortgage History
| Date | Status | Borrower | Loan Amount |
|---|---|---|---|
| Previous Owner | Ballestrasse David R | $384,000 | |
| Previous Owner | Ballestrasse Ione | $162,000 |
Source: Public Records
Tax History Compared to Growth
Tax History
| Year | Tax Paid | Tax Assessment Tax Assessment Total Assessment is a certain percentage of the fair market value that is determined by local assessors to be the total taxable value of land and additions on the property. | Land | Improvement |
|---|---|---|---|---|
| 2024 | $6,150 | $589,000 | $252,000 | $337,000 |
| 2023 | $5,878 | $505,000 | $217,000 | $288,000 |
| 2022 | $5,354 | $576,000 | $248,000 | $328,000 |
| 2021 | $5,246 | $467,000 | $214,000 | $253,000 |
| 2020 | $4,801 | $415,000 | $178,000 | $237,000 |
| 2018 | $4,817 | $381,000 | $163,000 | $218,000 |
| 2017 | $4,354 | $345,000 | $149,000 | $196,000 |
| 2016 | $4,202 | $316,000 | $137,000 | $179,000 |
| 2015 | $4,248 | $306,000 | $130,000 | $176,000 |
| 2014 | -- | $298,000 | $127,000 | $171,000 |
| 2013 | -- | $229,000 | $102,000 | $127,000 |
Source: Public Records
Map
Nearby Homes
- 2350 Rincon Ave
- 2311 Sunset Ave
- 1555 Kimberly Ave Unit 41
- 2234 Sunset Ave
- 1630 Kimberly Ave
- 2257 Estero Ave
- 2263 Anadoll Ave
- 1410 Mountain View Dr
- 1330 Mountain View Dr Unit 1330
- 3053 Porter St
- 2921 Frederickson St
- 2200 Mountain View Dr Unit 202N
- 2200 Mountain View Dr Unit 204N
- 2200 Mountain View Dr Unit 101S
- 2200 Mountain View Dr Unit 201S
- 42421 264th Ave SE
- 349 Rainier Ave
- 2125 Glacier St Unit 82
- 2108 Crystal Moutain Dr Unit 86
- 42102 264th Ave SE
- 28005 SE 432nd St
- 28014 SE 432nd St
- 27913 SE 432nd St
- 27823 SE 432nd St
- 27823 SE 432nd St
- 27927 SE 432nd St
- 28015 SE 432nd St
- 28102 SE 432nd St
- 28003 SE 432nd St
- 28117 SE 432nd St
- 28114 SE 432nd St
- 0 278th Ave SE
- 28111 SE 430th St
- 28126 SE 432nd St
- 28115 SE 430th St
- 43328 278th Ave SE
- 28129 SE 430th St
- 43408 278th Ave SE
- 28216 SE 432nd St