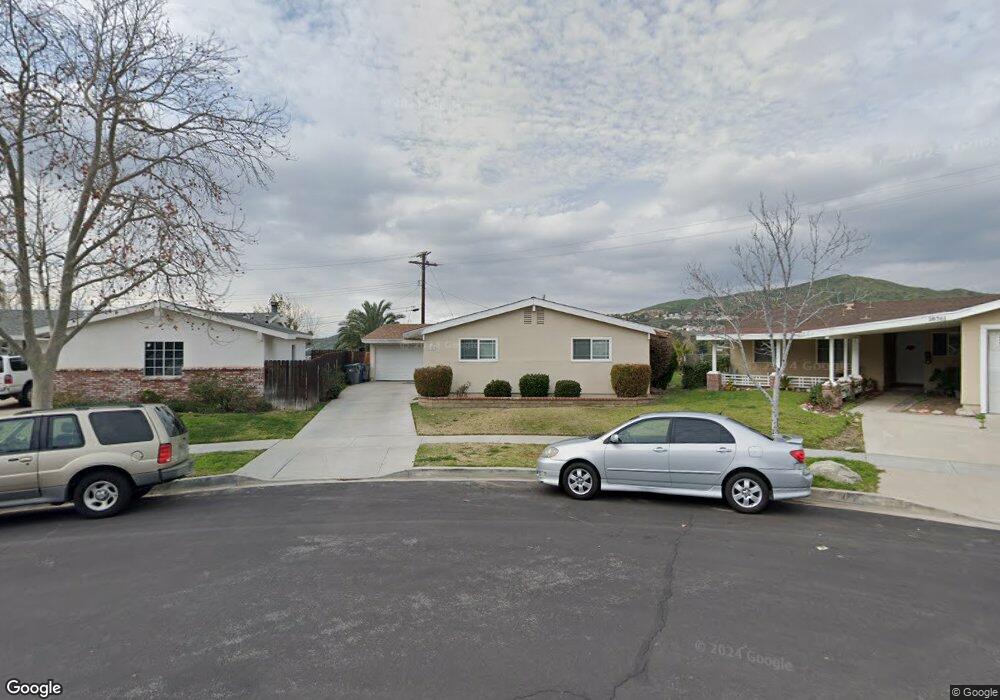
27947 Oakmoor St Canyon Country, CA 91351
Estimated Value: $718,000 - $741,000
4
Beds
2
Baths
1,260
Sq Ft
$579/Sq Ft
Est. Value
About This Home
This home is located at 27947 Oakmoor St, Canyon Country, CA 91351 and is currently estimated at $729,509, approximately $578 per square foot. 27947 Oakmoor St is a home located in Los Angeles County with nearby schools including Leona H. Cox Community Elementary School, Sierra Vista Junior High School, and Canyon High School.
Ownership History
Date
Name
Owned For
Owner Type
Purchase Details
Closed on
May 28, 2002
Sold by
Menchaca Daniel and Menchaca Julie L
Bought by
Menchaca Daniel and Menchaca Julie
Current Estimated Value
Home Financials for this Owner
Home Financials are based on the most recent Mortgage that was taken out on this home.
Original Mortgage
$164,500
Interest Rate
6.83%
Purchase Details
Closed on
Jan 26, 2000
Sold by
Shea Patrick B and Shea Colette J
Bought by
Menchaca Daniel and Menchaca Julie L
Home Financials for this Owner
Home Financials are based on the most recent Mortgage that was taken out on this home.
Original Mortgage
$161,500
Interest Rate
8.14%
Purchase Details
Closed on
Sep 28, 1993
Sold by
Jimenez Juan B and Jimenez Olivia P
Bought by
Shea Patrick B and Shea Colette J
Home Financials for this Owner
Home Financials are based on the most recent Mortgage that was taken out on this home.
Original Mortgage
$140,600
Interest Rate
6.95%
Create a Home Valuation Report for This Property
The Home Valuation Report is an in-depth analysis detailing your home's value as well as a comparison with similar homes in the area
Home Values in the Area
Average Home Value in this Area
Purchase History
| Date | Buyer | Sale Price | Title Company |
|---|---|---|---|
| Menchaca Daniel | -- | Old Republic Title Company | |
| Menchaca Daniel | $170,000 | Fidelity Title | |
| Shea Patrick B | $148,000 | Investors Title Company |
Source: Public Records
Mortgage History
| Date | Status | Borrower | Loan Amount |
|---|---|---|---|
| Closed | Menchaca Daniel | $164,500 | |
| Closed | Menchaca Daniel | $161,500 | |
| Previous Owner | Shea Patrick B | $140,600 |
Source: Public Records
Tax History Compared to Growth
Tax History
| Year | Tax Paid | Tax Assessment Tax Assessment Total Assessment is a certain percentage of the fair market value that is determined by local assessors to be the total taxable value of land and additions on the property. | Land | Improvement |
|---|---|---|---|---|
| 2025 | $3,992 | $261,263 | $184,425 | $76,838 |
| 2024 | $3,992 | $256,141 | $180,809 | $75,332 |
| 2023 | $3,911 | $251,119 | $177,264 | $73,855 |
| 2022 | $3,797 | $246,196 | $173,789 | $72,407 |
| 2021 | $3,734 | $241,370 | $170,382 | $70,988 |
| 2019 | $3,595 | $234,213 | $165,329 | $68,884 |
| 2018 | $3,469 | $229,622 | $162,088 | $67,534 |
| 2016 | $3,252 | $220,707 | $155,795 | $64,912 |
| 2015 | $3,317 | $217,392 | $153,455 | $63,937 |
| 2014 | $3,268 | $213,135 | $150,450 | $62,685 |
Source: Public Records
Map
Nearby Homes
- 18920 Felbridge St
- 27939 Bernina Ave
- 18718 Delight St
- 18816 Darter Dr
- 18717 Kimbrough St
- Plan 2 at Altis at Skyline
- Plan 3 at Altis at Skyline
- Plan 6 at Altis at Skyline
- Plan 1 at Altis at Skyline
- Plan 4 at Altis at Skyline
- Plan 5 at Altis at Skyline
- 28135 Foxlane Dr
- 27664 Cordovan Dr
- 28160 Foxlane Dr
- 18829 Vicci St
- 27711 Adonis Ln Unit 143
- 27635 Sienna Ridge Row
- 18323 Sp34 Soledad Canyon Rd
- 0 No Address Unit SR25216478
- 0 Sirius Addres Unit PW25230463
- 27945 Oakmoor St
- 18761 Oakmoor St
- 18900 Nadal St
- 18840 Nadal St
- 18906 Nadal St
- 27939 Oakmoor St
- 18755 Oakmoor St
- 18832 Nadal St
- 18914 Nadal St
- 27933 Oakmoor St
- 18826 Nadal St
- 27938 Oakmoor St
- 18747 Oakmoor St
- 18922 Nadal St
- 27925 Oakmoor St
- 27932 Oakmoor St
- 18907 Nadal St
- 18818 Nadal St
- 27922 Whites Canyon Rd
- 18739 Oakmoor St