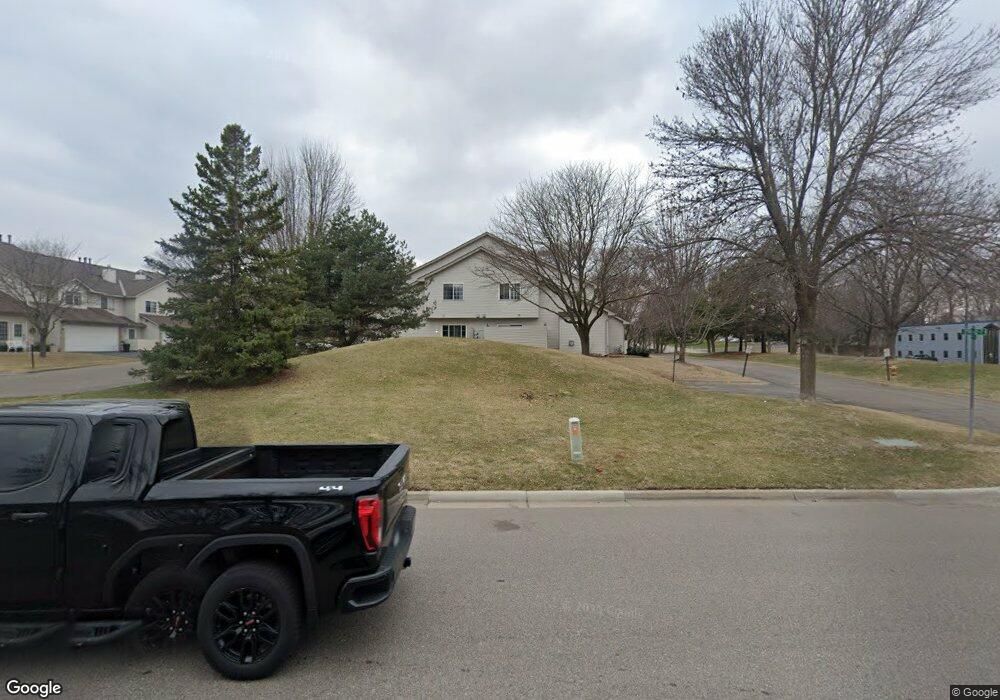
2795 Ranchview Ln N Unit 10 Plymouth, MN 55447
Estimated Value: $229,000 - $241,000
2
Beds
2
Baths
1,138
Sq Ft
$207/Sq Ft
Est. Value
About This Home
This home is located at 2795 Ranchview Ln N Unit 10, Plymouth, MN 55447 and is currently estimated at $235,361, approximately $206 per square foot. 2795 Ranchview Ln N Unit 10 is a home located in Hennepin County with nearby schools including Birchview Elementary School, Wayzata Central Middle School, and Wayzata High School.
Ownership History
Date
Name
Owned For
Owner Type
Purchase Details
Closed on
Oct 11, 2021
Sold by
Rd Brown Douglas
Bought by
Brown Shirin A
Current Estimated Value
Purchase Details
Closed on
May 19, 2017
Sold by
Morcomb Mark and Morcomb Sue
Bought by
Brown Douglas R D and Brown Shirin A
Home Financials for this Owner
Home Financials are based on the most recent Mortgage that was taken out on this home.
Original Mortgage
$144,450
Interest Rate
4.08%
Mortgage Type
New Conventional
Purchase Details
Closed on
Sep 16, 2016
Sold by
Martin Amy M and Martin Douglas
Bought by
Morcomb Mark
Purchase Details
Closed on
Jun 11, 2004
Sold by
Gard Thomas R and Gard Paula
Bought by
Schneider Amy M
Purchase Details
Closed on
Nov 26, 1997
Sold by
Ritchie Kent C
Bought by
Gard Thomas R
Purchase Details
Closed on
Jul 26, 1996
Sold by
Sunset Homes Cor
Bought by
Ritchie Kent L
Create a Home Valuation Report for This Property
The Home Valuation Report is an in-depth analysis detailing your home's value as well as a comparison with similar homes in the area
Home Values in the Area
Average Home Value in this Area
Purchase History
| Date | Buyer | Sale Price | Title Company |
|---|---|---|---|
| Brown Shirin A | -- | -- | |
| Brown Douglas R D | $160,500 | Land Title Inc | |
| Morcomb Mark | $147,500 | Land Title Inc | |
| Schneider Amy M | $169,600 | -- | |
| Gard Thomas R | $94,500 | -- | |
| Ritchie Kent L | $85,950 | -- | |
| Sunset Homes Corp | $23,000 | -- |
Source: Public Records
Mortgage History
| Date | Status | Borrower | Loan Amount |
|---|---|---|---|
| Previous Owner | Brown Douglas R D | $144,450 |
Source: Public Records
Tax History Compared to Growth
Tax History
| Year | Tax Paid | Tax Assessment Tax Assessment Total Assessment is a certain percentage of the fair market value that is determined by local assessors to be the total taxable value of land and additions on the property. | Land | Improvement |
|---|---|---|---|---|
| 2024 | $2,392 | $233,600 | $40,000 | $193,600 |
| 2023 | $2,315 | $228,800 | $33,000 | $195,800 |
| 2022 | $2,078 | $228,000 | $41,000 | $187,000 |
| 2021 | $1,997 | $186,000 | $32,000 | $154,000 |
| 2020 | $1,800 | $180,000 | $32,000 | $148,000 |
| 2019 | $1,610 | $161,000 | $37,000 | $124,000 |
| 2018 | $1,572 | $147,000 | $34,000 | $113,000 |
| 2017 | $1,697 | $133,000 | $31,000 | $102,000 |
| 2016 | $1,577 | $120,000 | $28,000 | $92,000 |
| 2015 | $1,607 | $119,400 | $27,800 | $91,600 |
| 2014 | -- | $99,500 | $24,900 | $74,600 |
Source: Public Records
Map
Nearby Homes
- 2728 Shenandoah Ln N
- 15710 26th Ave N Unit C
- 15805 26th Ave N Unit B
- 15625 24th Ave N Unit E
- 15640 24th Ave N Unit B
- 2635 Weston Ln N
- 15665 24th Ave N Unit C
- 2225 Ranchview Ln N Unit 5
- 16520 27th Ave N
- 2040 Shenandoah Ct Unit B
- 1900 Shenandoah Ct Unit H
- 16035 36th Place N
- 15655 17th Place N
- 1844 Zanzibar Ln N
- 17015 30th Ave N
- 15640 16th Ave N
- 1705 Archer Ct
- 1712 Archer Ct
- 15800 16th Ave N
- 1737 Archer Ct
- 2795 Ranchview Ln N Unit 12
- 2795 Ranchview Ln N Unit 11
- 2795 Ranchview Ln N Unit 9
- 2795 Ranchview Ln N Unit 8
- 2795 Ranchview Ln N Unit 7
- 2795 Ranchview Ln N Unit 6
- 2795 Ranchview Ln N Unit 5
- 2795 Ranchview Ln N Unit 4
- 2795 Ranchview Ln N Unit 2
- 2795 Ranchview Ln N Unit 1
- 2795 2795 Ranchview-Lane-n
- 2795 2795 Ranchview Ln N
- 2785 Ranchview Ln N Unit 12
- 2785 Ranchview Ln N Unit 11
- 2785 Ranchview Ln N Unit 10
- 2785 Ranchview Ln N Unit 9
- 2785 Ranchview Ln N Unit 8
- 2785 Ranchview Ln N Unit 7
- 2785 Ranchview Ln N Unit 6
- 2785 Ranchview Ln N Unit 5