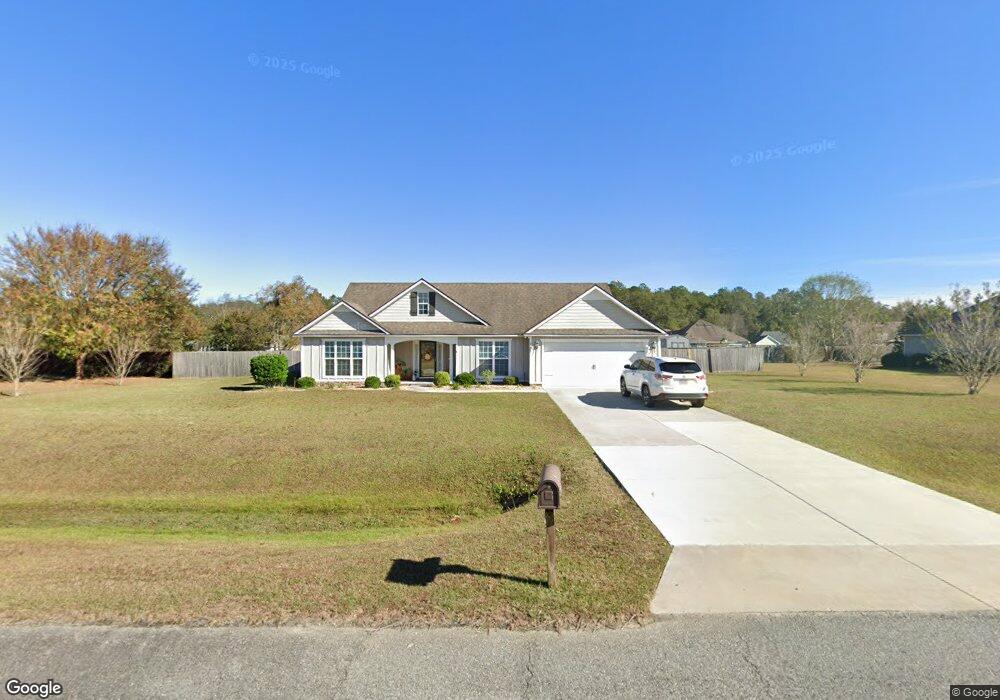
2796 Rabbit Ridge Run Valdosta, GA 31605
Estimated Value: $271,202 - $296,000
4
Beds
2
Baths
1,574
Sq Ft
$181/Sq Ft
Est. Value
About This Home
This home is located at 2796 Rabbit Ridge Run, Valdosta, GA 31605 and is currently estimated at $285,551, approximately $181 per square foot. 2796 Rabbit Ridge Run is a home located in Lowndes County with nearby schools including Moulton-Branch Elementary School, Pine Grove Middle School, and Lowndes High School.
Ownership History
Date
Name
Owned For
Owner Type
Purchase Details
Closed on
Dec 9, 2016
Sold by
Banks Terry B
Bought by
Hamel Jon and Hamel Janice L
Current Estimated Value
Home Financials for this Owner
Home Financials are based on the most recent Mortgage that was taken out on this home.
Original Mortgage
$156,650
Outstanding Balance
$126,296
Interest Rate
3.47%
Mortgage Type
New Conventional
Estimated Equity
$159,255
Purchase Details
Closed on
Jul 29, 2013
Sold by
Constructi Maples Brothers
Bought by
Banks Terry Brian
Home Financials for this Owner
Home Financials are based on the most recent Mortgage that was taken out on this home.
Original Mortgage
$136,000
Interest Rate
4.5%
Mortgage Type
New Conventional
Purchase Details
Closed on
Aug 3, 2012
Sold by
K3p Properties Llc
Bought by
Maples Brothers Construction L
Purchase Details
Closed on
Jun 22, 2006
Bought by
K3p Properties Llc
Create a Home Valuation Report for This Property
The Home Valuation Report is an in-depth analysis detailing your home's value as well as a comparison with similar homes in the area
Home Values in the Area
Average Home Value in this Area
Purchase History
| Date | Buyer | Sale Price | Title Company |
|---|---|---|---|
| Hamel Jon | $164,900 | -- | |
| Banks Terry Brian | $159,500 | -- | |
| Maples Brothers Construction L | $26,750 | -- | |
| K3p Properties Llc | -- | -- |
Source: Public Records
Mortgage History
| Date | Status | Borrower | Loan Amount |
|---|---|---|---|
| Open | Hamel Jon | $156,650 | |
| Previous Owner | Banks Terry Brian | $136,000 |
Source: Public Records
Tax History Compared to Growth
Tax History
| Year | Tax Paid | Tax Assessment Tax Assessment Total Assessment is a certain percentage of the fair market value that is determined by local assessors to be the total taxable value of land and additions on the property. | Land | Improvement |
|---|---|---|---|---|
| 2024 | $2,476 | $96,574 | $14,000 | $82,574 |
| 2023 | $2,365 | $90,684 | $14,000 | $76,684 |
| 2022 | $2,315 | $80,845 | $14,000 | $66,845 |
| 2021 | $1,981 | $65,932 | $14,000 | $51,932 |
| 2020 | $1,844 | $65,932 | $14,000 | $51,932 |
| 2019 | $1,863 | $65,932 | $14,000 | $51,932 |
| 2018 | $1,882 | $65,932 | $14,000 | $51,932 |
| 2017 | $1,665 | $57,410 | $14,000 | $43,410 |
| 2016 | $1,477 | $56,610 | $14,000 | $42,610 |
| 2015 | $1,418 | $56,610 | $14,000 | $42,610 |
| 2014 | $1,446 | $56,610 | $14,000 | $42,610 |
Source: Public Records
Map
Nearby Homes
- 2801 Cotton Bay Crossing
- 2766 Rabbit Ridge Run
- 2933 Huckleberry Hollow
- 4507 Inner Perimeter Rd
- 3734 Butler Ln
- 3524 Emmaus Rd
- 3683 Knights Mill Dr
- 3691 Knights Mill Dr
- 3222 Fred Walker Rd
- 3365 Norton Place
- 3762 Knights Mill Dr
- 3761 Knights Mill Dr
- 3311 Lakeland Hwy
- 2737 Dogwood Cir
- 3105 Wallace Dr
- 4085 Chadwyck Dr
- 4203 Wilshire Dr
- 2943 Findley Chase
- 4305 Brandonshire Ln
- 3528 Harvest Trail
- 2790 Rabbit Ridge Run
- 2795 Cotton Bay Crossing
- 2795 Rabbit Ridge Run
- 2807 Cotton Bay Crossing
- 2789 Rabbit Ridge Run
- 2801 Rabbit Ridge Run
- 2808 Rabbit Ridge Run
- 2784 Rabbit Ridge Run
- 2789 Cotton Bay Crossing
- 2807 Rabbit Ridge Run
- 2815 Cotton Bay Crossing
- 2782 Timbercreek Trail
- 2776 Timbercreek Trail
- 2788 Timbercreek Trail
- 2814 Rabbit Ridge Run
- 2778 Rabbit Ridge Run
- 2804 Cotton Bay Crossing
- 2808 Cotton Bay Crossing
- 2794 Cotton Bay Crossing
- 2777 Rabbit Ridge Run