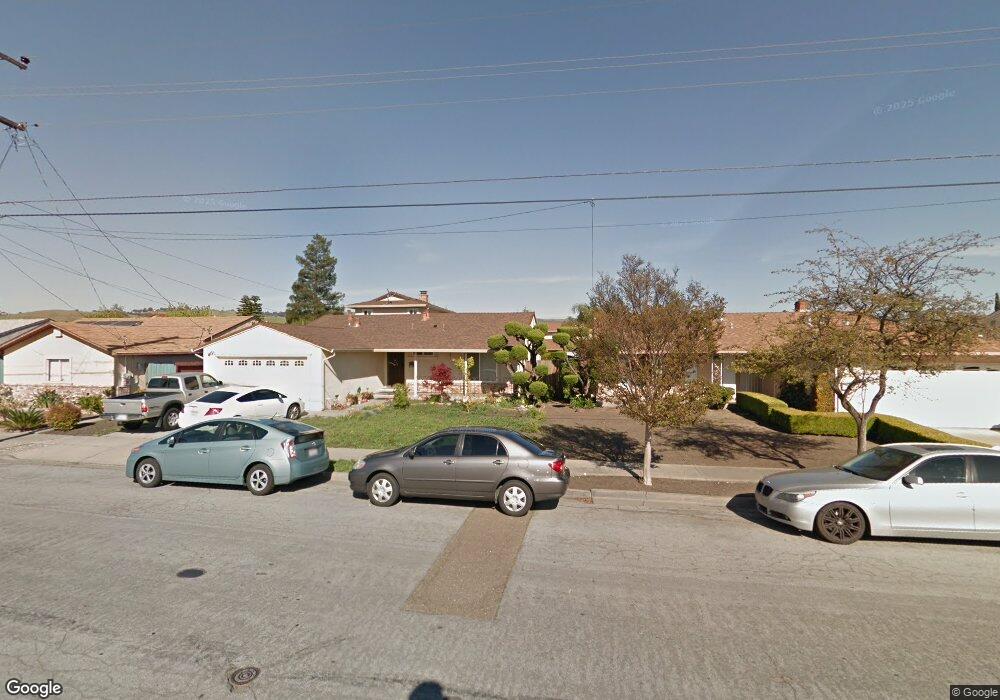
27990 Thackeray Ave Hayward, CA 94544
Tennyson-Alquire NeighborhoodEstimated Value: $857,000 - $985,000
4
Beds
3
Baths
1,908
Sq Ft
$487/Sq Ft
Est. Value
About This Home
This home is located at 27990 Thackeray Ave, Hayward, CA 94544 and is currently estimated at $928,713, approximately $486 per square foot. 27990 Thackeray Ave is a home located in Alameda County with nearby schools including Ruus Elementary School, Cesar Chavez Middle School, and Tennyson High School.
Ownership History
Date
Name
Owned For
Owner Type
Purchase Details
Closed on
Aug 28, 2023
Sold by
Agbunag Fontanilla Cleto and Cahigas Fontanilla Luisa
Bought by
Cleto Agbunag Fontanilla And Luisa Cahigas Fo and Fontanilla
Current Estimated Value
Purchase Details
Closed on
Dec 30, 2008
Sold by
Mummert Antionette M and The Mummert Family Trust
Bought by
Cahigas Fontanilla Cleto Agbunag and Cahigas Fontanilla Luisa
Home Financials for this Owner
Home Financials are based on the most recent Mortgage that was taken out on this home.
Original Mortgage
$377,045
Interest Rate
5.49%
Mortgage Type
VA
Purchase Details
Closed on
Aug 22, 1996
Sold by
Mummert Leonard O and Mummert M A
Bought by
Mummert Leonard O and Mummert Antionette M
Create a Home Valuation Report for This Property
The Home Valuation Report is an in-depth analysis detailing your home's value as well as a comparison with similar homes in the area
Home Values in the Area
Average Home Value in this Area
Purchase History
| Date | Buyer | Sale Price | Title Company |
|---|---|---|---|
| Cleto Agbunag Fontanilla And Luisa Cahigas Fo | -- | None Listed On Document | |
| Cahigas Fontanilla Cleto Agbunag | $365,000 | Chicago Title Company | |
| Mummert Leonard O | -- | -- |
Source: Public Records
Mortgage History
| Date | Status | Borrower | Loan Amount |
|---|---|---|---|
| Previous Owner | Cahigas Fontanilla Cleto Agbunag | $377,045 |
Source: Public Records
Tax History
| Year | Tax Paid | Tax Assessment Tax Assessment Total Assessment is a certain percentage of the fair market value that is determined by local assessors to be the total taxable value of land and additions on the property. | Land | Improvement |
|---|---|---|---|---|
| 2025 | $5,752 | $462,998 | $140,999 | $328,999 |
| 2024 | $5,752 | $453,786 | $138,236 | $322,550 |
| 2023 | $5,665 | $451,752 | $135,525 | $316,227 |
| 2022 | $5,555 | $435,897 | $132,869 | $310,028 |
| 2021 | $5,509 | $427,214 | $130,264 | $303,950 |
| 2020 | $5,448 | $429,764 | $128,929 | $300,835 |
| 2019 | $5,490 | $421,340 | $126,402 | $294,938 |
| 2018 | $5,155 | $413,081 | $123,924 | $289,157 |
| 2017 | $5,036 | $404,981 | $121,494 | $283,487 |
| 2016 | $4,745 | $397,043 | $119,113 | $277,930 |
| 2015 | $4,650 | $391,082 | $117,324 | $273,758 |
| 2014 | $4,417 | $383,424 | $115,027 | $268,397 |
Source: Public Records
Map
Nearby Homes
- 27906 Thackeray Ave
- 27781 Dickens Ave
- 27505 Tampa Ave Unit 39
- 27720 Seminole Way
- 1587 de Lemos Ave
- 28538 Huntwood Ave
- 29043 Windemere Rd
- 1438 Buckingham Way
- 1476 Zamora Ct
- 761 Shepherd Ave
- 27844 Miami Ave
- 27707 La Porte Ave
- 139 Mars Ave Unit 139
- 27831 Miami Ave
- 28882 Miranda St
- 1481 Rieger Ave
- 28315 Rochelle Ave
- 29255 Harpoon Way
- 27777 Pistachio Ct
- 994 Westwood St
- 28022 Thackeray Ave
- 27978 Thackeray Ave
- 1174 Lovelock Way
- 27966 Thackeray Ave
- 27979 Thackeray Ave
- 1166 Lovelock Way
- 1004 Marlowe Ln
- 28215 Karn Dr
- 28066 Thackeray Ave
- 27952 Thackeray Ave
- 1175 Lovelock Way
- 28229 Karn Dr
- 27959 Thackeray Ave
- 1023 Marlowe Ln
- 1158 Lovelock Way
- 1022 Marlowe Ln
- 28088 Thackeray Ave
- 1053 Sumatra St
- 27942 Thackeray Ave
- 28247 Karn Dr
Your Personal Tour Guide
Ask me questions while you tour the home.