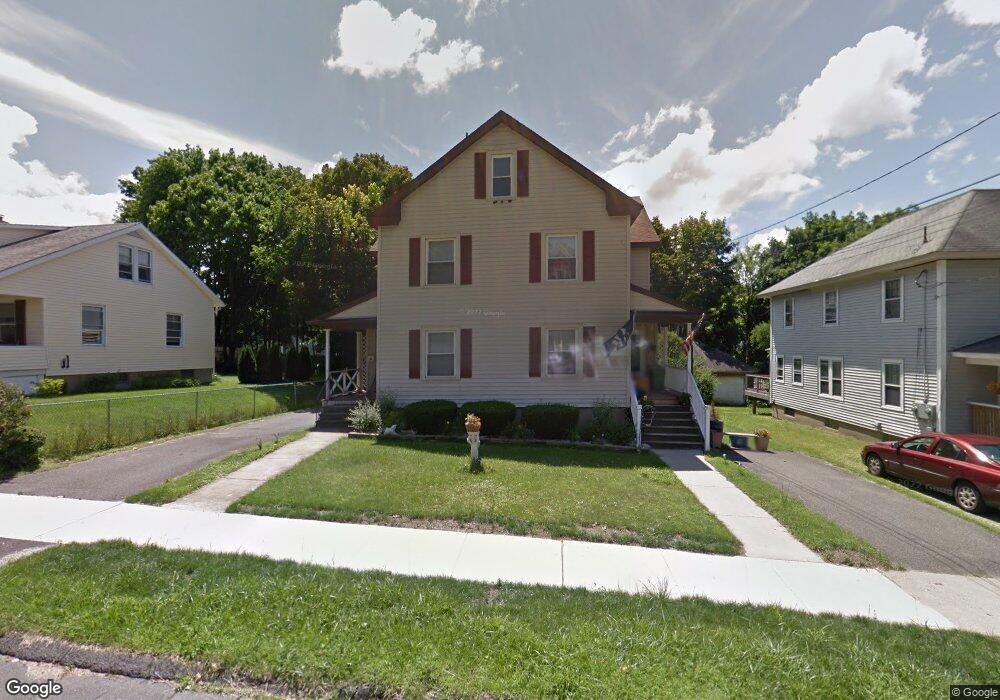
28 Abbott St Pittsfield, MA 01201
Estimated Value: $284,000 - $314,000
6
Beds
3
Baths
3,042
Sq Ft
$98/Sq Ft
Est. Value
About This Home
This home is located at 28 Abbott St, Pittsfield, MA 01201 and is currently estimated at $297,656, approximately $97 per square foot. 28 Abbott St is a home located in Berkshire County with nearby schools including Morningside Community School, John T. Reid Middle School, and Taconic High School.
Ownership History
Date
Name
Owned For
Owner Type
Purchase Details
Closed on
Jul 25, 2008
Sold by
Desantis Linda L and Desantis Louis J
Bought by
Schettini Joan D
Current Estimated Value
Home Financials for this Owner
Home Financials are based on the most recent Mortgage that was taken out on this home.
Original Mortgage
$148,500
Outstanding Balance
$96,743
Interest Rate
6.35%
Mortgage Type
Purchase Money Mortgage
Estimated Equity
$200,913
Create a Home Valuation Report for This Property
The Home Valuation Report is an in-depth analysis detailing your home's value as well as a comparison with similar homes in the area
Home Values in the Area
Average Home Value in this Area
Purchase History
| Date | Buyer | Sale Price | Title Company |
|---|---|---|---|
| Schettini Joan D | $170,000 | -- | |
| Schettini Joan D | $170,000 | -- | |
| Schettini Joan D | $170,000 | -- |
Source: Public Records
Mortgage History
| Date | Status | Borrower | Loan Amount |
|---|---|---|---|
| Open | Schettini Joan D | $148,500 | |
| Closed | Schettini Joan D | $148,500 |
Source: Public Records
Tax History
| Year | Tax Paid | Tax Assessment Tax Assessment Total Assessment is a certain percentage of the fair market value that is determined by local assessors to be the total taxable value of land and additions on the property. | Land | Improvement |
|---|---|---|---|---|
| 2025 | $4,501 | $250,900 | $62,300 | $188,600 |
| 2024 | $4,157 | $225,300 | $62,300 | $163,000 |
| 2023 | $3,798 | $207,300 | $57,500 | $149,800 |
| 2022 | $3,699 | $199,300 | $57,500 | $141,800 |
| 2021 | $3,365 | $174,800 | $57,500 | $117,300 |
| 2020 | $3,148 | $159,700 | $46,000 | $113,700 |
| 2019 | $3,020 | $155,500 | $38,300 | $117,200 |
| 2018 | $2,697 | $134,800 | $38,300 | $96,500 |
| 2017 | $2,695 | $137,300 | $36,400 | $100,900 |
| 2016 | $2,617 | $139,500 | $36,400 | $103,100 |
| 2015 | $2,519 | $139,500 | $36,400 | $103,100 |
Source: Public Records
Map
Nearby Homes
- 26 Springside Ave
- 30 Edgewood Rd
- 110 Lenox Ave
- 71 Weller Ave
- 0 Courtland Place
- 29 Glenwood Ave
- 269 Second St
- 0 Brown St
- I11001904 Scammell Ave
- 56 Spring St
- 242 Wahconah St
- 58 Seymour St
- 9 Lincoln St
- 0 Parker St
- 48 Brown St
- 71 Dickinson Ave
- 33 Maplewood Ave Unit 103
- 40 Pecks Rd
- 118 Lincoln St
- 27 Pleasant St
Your Personal Tour Guide
Ask me questions while you tour the home.