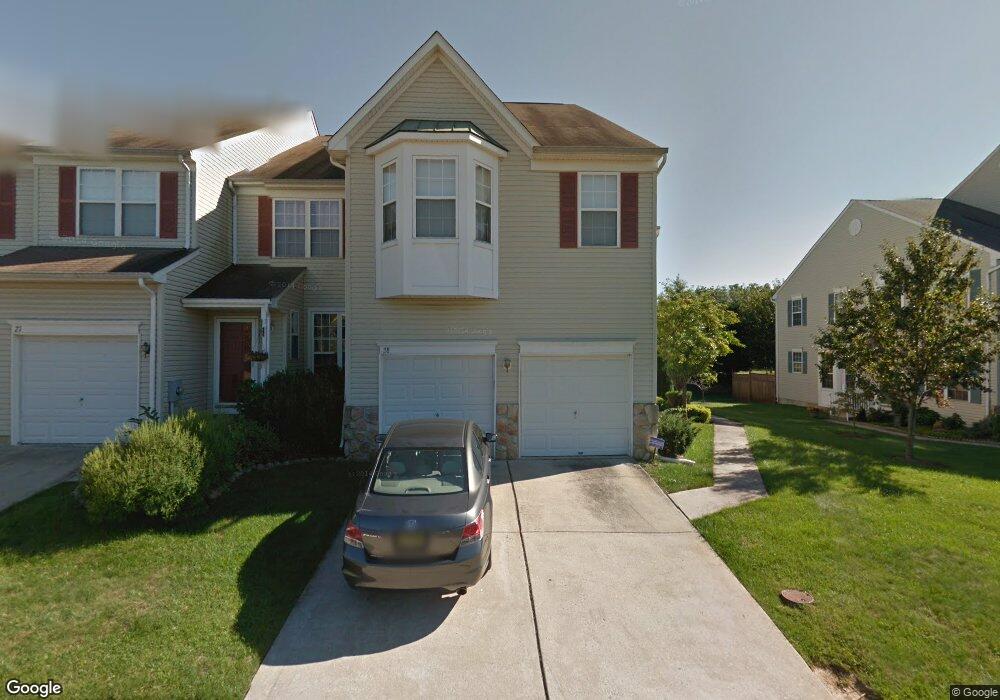
28 Andover Ct Bordentown, NJ 08505
Estimated Value: $533,000 - $607,000
--
Bed
--
Bath
2,445
Sq Ft
$233/Sq Ft
Est. Value
About This Home
This home is located at 28 Andover Ct, Bordentown, NJ 08505 and is currently estimated at $569,261, approximately $232 per square foot. 28 Andover Ct is a home located in Burlington County with nearby schools including Bordentown Reg High School and Meadow View Junior Academy.
Ownership History
Date
Name
Owned For
Owner Type
Purchase Details
Closed on
Jun 18, 2005
Sold by
Mafarachisi Sharon B and Mafarachisi Tendai
Bought by
Cendant Mobility Financial Corp
Current Estimated Value
Home Financials for this Owner
Home Financials are based on the most recent Mortgage that was taken out on this home.
Original Mortgage
$340,005
Outstanding Balance
$176,931
Interest Rate
5.71%
Mortgage Type
Fannie Mae Freddie Mac
Estimated Equity
$392,330
Purchase Details
Closed on
Jun 15, 2005
Sold by
Cendant Mobility Financial Corp
Bought by
Nezius Narha and Innocent Yves
Home Financials for this Owner
Home Financials are based on the most recent Mortgage that was taken out on this home.
Original Mortgage
$340,005
Outstanding Balance
$176,931
Interest Rate
5.71%
Mortgage Type
Fannie Mae Freddie Mac
Estimated Equity
$392,330
Purchase Details
Closed on
Feb 14, 2005
Sold by
Mafarachisi Sharon and Barton Sharon
Bought by
Mafarachisi Sharon and Mafarachisi Tendai
Purchase Details
Closed on
Nov 23, 1999
Sold by
Quaker Group Developments Lp
Bought by
Barton Sharon C
Home Financials for this Owner
Home Financials are based on the most recent Mortgage that was taken out on this home.
Original Mortgage
$163,800
Interest Rate
7.73%
Mortgage Type
Purchase Money Mortgage
Create a Home Valuation Report for This Property
The Home Valuation Report is an in-depth analysis detailing your home's value as well as a comparison with similar homes in the area
Home Values in the Area
Average Home Value in this Area
Purchase History
| Date | Buyer | Sale Price | Title Company |
|---|---|---|---|
| Cendant Mobility Financial Corp | $357,900 | Old Republic National Title | |
| Nezius Narha | $357,900 | Old Republic National Title | |
| Mafarachisi Sharon | -- | -- | |
| Barton Sharon C | $182,066 | -- |
Source: Public Records
Mortgage History
| Date | Status | Borrower | Loan Amount |
|---|---|---|---|
| Open | Cendant Mobility Financial Corp | $340,005 | |
| Closed | Nezius Narha | $340,005 | |
| Previous Owner | Barton Sharon C | $163,800 |
Source: Public Records
Tax History Compared to Growth
Tax History
| Year | Tax Paid | Tax Assessment Tax Assessment Total Assessment is a certain percentage of the fair market value that is determined by local assessors to be the total taxable value of land and additions on the property. | Land | Improvement |
|---|---|---|---|---|
| 2025 | $10,532 | $285,200 | $57,500 | $227,700 |
| 2024 | $9,608 | $285,200 | $57,500 | $227,700 |
| 2023 | $9,608 | $285,200 | $57,500 | $227,700 |
| 2022 | $9,700 | $285,200 | $57,500 | $227,700 |
| 2021 | $10,179 | $285,200 | $57,500 | $227,700 |
| 2020 | $10,165 | $285,200 | $57,500 | $227,700 |
| 2019 | $9,979 | $285,200 | $57,500 | $227,700 |
| 2018 | $9,851 | $285,200 | $57,500 | $227,700 |
| 2017 | $9,546 | $285,200 | $57,500 | $227,700 |
| 2016 | $9,329 | $285,200 | $57,500 | $227,700 |
| 2015 | $9,129 | $285,200 | $57,500 | $227,700 |
| 2014 | $8,719 | $285,200 | $57,500 | $227,700 |
Source: Public Records
Map
Nearby Homes
- 26 Andover Ct
- 15 Wyndham Ct
- 35 Farmington Ct
- 7 Westbury Ct
- 26 Kennebec Ct Unit 22
- 14 Tioga Ct Unit 22353
- 183 Bordentown Georgetown Rd
- 3 Exeter Ct Unit 22137
- 26 Exeter Ct Unit 22160
- 39 Gloucester Ct
- 31 Gloucester Ct Unit 22295
- 6 Delaware Dr
- 145 White Pine Rd
- 87 Bordentown Chesterfield Rd
- 220-240 White Pine Rd
- 2 Thorn Ln
- 199 Bordentown Georgetown Rd
- 31 Fenton Ln
- 0 Bordentown Georgetown Rd
- 1 Stevenson Rd