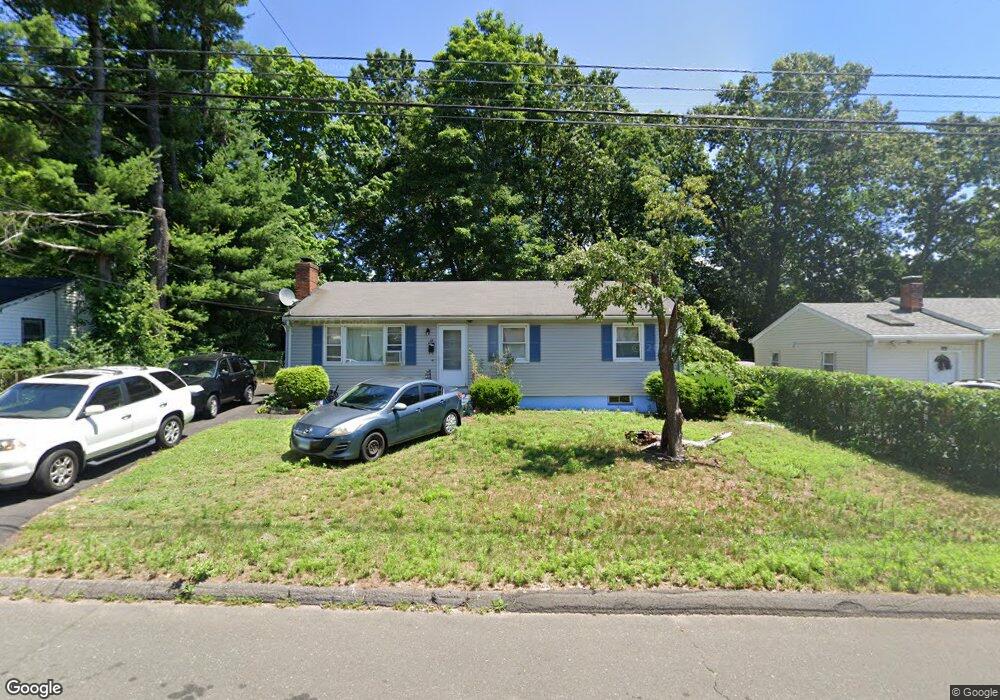
28 Banfield Ln Bloomfield, CT 06002
Estimated Value: $306,995 - $338,000
4
Beds
3
Baths
1,100
Sq Ft
$290/Sq Ft
Est. Value
About This Home
This home is located at 28 Banfield Ln, Bloomfield, CT 06002 and is currently estimated at $318,999, approximately $289 per square foot. 28 Banfield Ln is a home located in Hartford County with nearby schools including Carmen Arace Intermediate School, Metacomet School, and Laurel School.
Ownership History
Date
Name
Owned For
Owner Type
Purchase Details
Closed on
Feb 1, 1991
Sold by
Williams Leo
Bought by
Huie Gwendolyn and Huie Judith
Current Estimated Value
Home Financials for this Owner
Home Financials are based on the most recent Mortgage that was taken out on this home.
Original Mortgage
$129,550
Interest Rate
9.52%
Mortgage Type
Purchase Money Mortgage
Purchase Details
Closed on
Oct 13, 1987
Sold by
Oleary Peter
Bought by
Williams Leo
Home Financials for this Owner
Home Financials are based on the most recent Mortgage that was taken out on this home.
Original Mortgage
$55,000
Interest Rate
10.33%
Mortgage Type
Purchase Money Mortgage
Purchase Details
Closed on
May 4, 1987
Sold by
C.H.F.A.
Bought by
Oleary Peter
Home Financials for this Owner
Home Financials are based on the most recent Mortgage that was taken out on this home.
Original Mortgage
$64,000
Interest Rate
8.99%
Mortgage Type
Purchase Money Mortgage
Create a Home Valuation Report for This Property
The Home Valuation Report is an in-depth analysis detailing your home's value as well as a comparison with similar homes in the area
Home Values in the Area
Average Home Value in this Area
Purchase History
| Date | Buyer | Sale Price | Title Company |
|---|---|---|---|
| Huie Gwendolyn | $139,000 | -- | |
| Williams Leo | $118,000 | -- | |
| Oleary Peter | $70,000 | -- |
Source: Public Records
Mortgage History
| Date | Status | Borrower | Loan Amount |
|---|---|---|---|
| Closed | Oleary Peter | $129,550 | |
| Previous Owner | Oleary Peter | $55,000 | |
| Previous Owner | Oleary Peter | $64,000 |
Source: Public Records
Tax History Compared to Growth
Tax History
| Year | Tax Paid | Tax Assessment Tax Assessment Total Assessment is a certain percentage of the fair market value that is determined by local assessors to be the total taxable value of land and additions on the property. | Land | Improvement |
|---|---|---|---|---|
| 2025 | $6,481 | $167,300 | $34,440 | $132,860 |
| 2024 | $4,279 | $105,420 | $30,660 | $74,760 |
| 2023 | $4,204 | $105,420 | $30,660 | $74,760 |
| 2022 | $3,904 | $105,420 | $30,660 | $74,760 |
| 2021 | $4,014 | $105,420 | $30,660 | $74,760 |
| 2020 | $3,954 | $105,420 | $30,660 | $74,760 |
| 2019 | $4,171 | $104,370 | $30,660 | $73,710 |
| 2018 | $3,589 | $89,670 | $30,660 | $59,010 |
| 2017 | $3,592 | $89,670 | $30,660 | $59,010 |
| 2016 | $3,511 | $89,670 | $30,660 | $59,010 |
| 2015 | $3,452 | $89,670 | $30,660 | $59,010 |
| 2014 | $4,023 | $107,730 | $42,000 | $65,730 |
Source: Public Records
Map
Nearby Homes
- 31 Farmstead Cir
- 15 Kelsey Place
- 26 Kelsey Place
- 1130 Blue Hills Ave
- 1083 Blue Hills Ave Unit G
- 2 Sandra Dr
- 5 Eagleton Dr
- 45 E Wintonbury Ave
- 35 Fairfield Ln
- 29 Privilege Rd
- 99 Pepperbush Way
- 18 Englewood Ave
- 10 Greenbriar Dr Unit 12
- 38 Sutton Place Unit 38
- 39 Wade Ave
- 18 Walsh St
- 31 Sutton Place
- 1220 Blue Hills Ave
- 29 Quail Hollow Dr
- 580 W Wolcott Ave