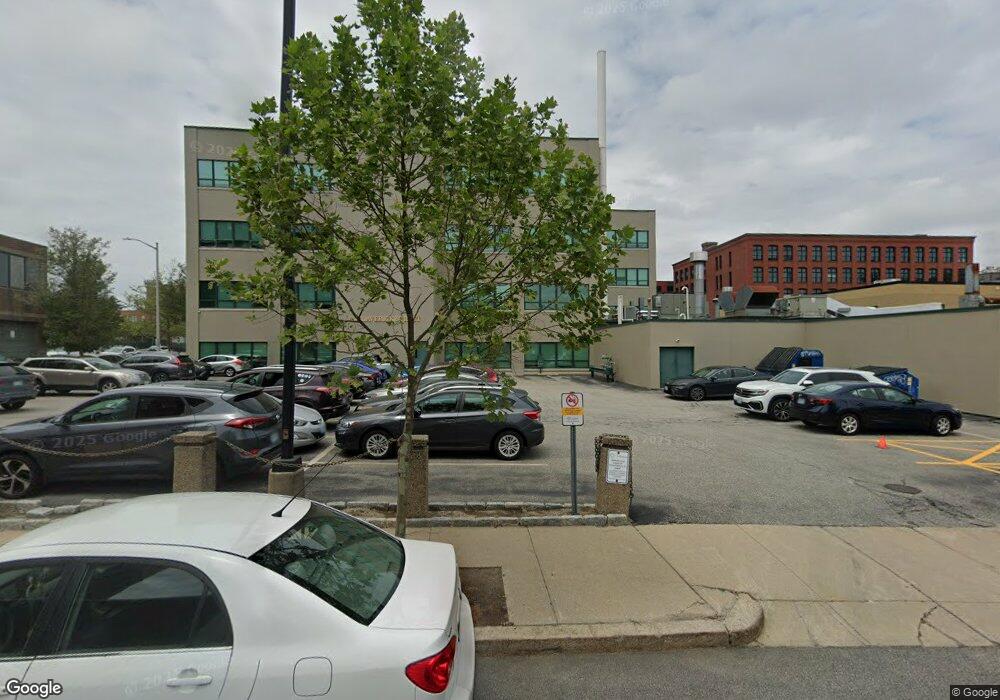
28 Bassett St Unit 6F Providence, RI 02903
Upper South Providence NeighborhoodEstimated Value: $365,000 - $562,000
2
Beds
1
Bath
1,538
Sq Ft
$288/Sq Ft
Est. Value
About This Home
This home is located at 28 Bassett St Unit 6F, Providence, RI 02903 and is currently estimated at $442,666, approximately $287 per square foot. 28 Bassett St Unit 6F is a home located in Providence County with nearby schools including Asa Messer Elementary School, Charles N. Fortes Elementary School, and Robert L. Bailey IV Elementary.
Ownership History
Date
Name
Owned For
Owner Type
Purchase Details
Closed on
Mar 17, 2015
Sold by
Troia Linda M
Bought by
Troia Linda M and Hamann James
Current Estimated Value
Purchase Details
Closed on
Dec 21, 2001
Sold by
Berio Stefano
Bought by
Gelardetti Walter D
Purchase Details
Closed on
May 5, 1999
Sold by
Balsamo Paul A
Bought by
Macalino Grace E
Purchase Details
Closed on
Sep 4, 1998
Sold by
Devine William and Devine Lisa
Bought by
Dicarlo Lisa
Purchase Details
Closed on
Jul 23, 1998
Sold by
Cicilline David N
Bought by
Drake Patte M
Purchase Details
Closed on
Apr 16, 1997
Sold by
Wedgewood Properties L
Bought by
Griggs Dan A
Purchase Details
Closed on
Mar 26, 1997
Sold by
Wedgewood Properties
Bought by
Troia Linda M and Desano Anthony R
Create a Home Valuation Report for This Property
The Home Valuation Report is an in-depth analysis detailing your home's value as well as a comparison with similar homes in the area
Home Values in the Area
Average Home Value in this Area
Purchase History
| Date | Buyer | Sale Price | Title Company |
|---|---|---|---|
| Troia Linda M | -- | -- | |
| Troia Linda M | -- | -- | |
| Gelardetti Walter D | $130,000 | -- | |
| Macalino Grace E | $80,000 | -- | |
| Dicarlo Lisa | $104,500 | -- | |
| Drake Patte M | $107,000 | -- | |
| Griggs Dan A | $47,000 | -- | |
| Troia Linda M | $61,500 | -- | |
| Troia Linda M | $61,500 | -- |
Source: Public Records
Mortgage History
| Date | Status | Borrower | Loan Amount |
|---|---|---|---|
| Previous Owner | Troia Linda M | $50,000 | |
| Previous Owner | Troia Linda M | $132,500 |
Source: Public Records
Tax History Compared to Growth
Tax History
| Year | Tax Paid | Tax Assessment Tax Assessment Total Assessment is a certain percentage of the fair market value that is determined by local assessors to be the total taxable value of land and additions on the property. | Land | Improvement |
|---|---|---|---|---|
| 2025 | $8,027 | $549,800 | $0 | $549,800 |
| 2024 | $7,924 | $431,800 | $0 | $431,800 |
| 2023 | $7,924 | $431,800 | $0 | $431,800 |
| 2022 | $7,686 | $431,800 | $0 | $431,800 |
| 2021 | $7,685 | $312,900 | $0 | $312,900 |
| 2020 | $7,685 | $312,900 | $0 | $312,900 |
| 2019 | $7,685 | $312,900 | $0 | $312,900 |
| 2018 | $8,156 | $255,200 | $0 | $255,200 |
| 2017 | $8,156 | $255,200 | $0 | $255,200 |
| 2016 | $8,156 | $255,200 | $0 | $255,200 |
| 2015 | $7,997 | $241,600 | $0 | $241,600 |
| 2014 | $8,154 | $241,600 | $0 | $241,600 |
| 2013 | $6,797 | $201,400 | $0 | $201,400 |
Source: Public Records
Map
Nearby Homes
- 73 Beacon Ave
- 225 Weybosset St Unit 12
- 225 Weybosset St Unit 2
- 385 Westminster St Unit 5C
- 93 Eddy St
- 755 Westminster St Unit 404
- 65 Weybosset St Unit 211
- 65 Weybosset St Unit 202
- 65 Weybosset St Unit 223
- 109 Somerset St
- 9 Hayward St
- 555 S Water St Unit 325
- 84 Transit St
- 1 W Exchange St Unit 2604
- 1 W Exchange St Unit 2602
- 512 Pine St Unit C3
- 36 Eudora St
- 200 Exchange St Unit 414
- 100 Exchange St Unit 1301
- 100 Exchange St Unit 603
- 28 Bassett St Unit 6E
- 28 Bassett St Unit 5D
- 28 Bassett St Unit 2A
- 28 Bassett St Unit 5A
- 28 Bassett St Unit 6A
- 28 Bassett St Unit 3E
- 28 Bassett St Unit 3C
- 28 Bassett St Unit 5F
- 28 Bassett St Unit 3B
- 28 Bassett St Unit 5B
- 28 Bassett St Unit 3D
- 28 Bassett St Unit 6C
- 28 Bassett St Unit 3F
- 28 Bassett St Unit 3A
- 28 Bassett St Unit 6D
- 28 Bassett St Unit 6G
- 28 Bassett St Unit 6B
- 28 Bassett St Unit 5G
- 28 Bassett St Unit 5E
- 28 Bassett St Unit 5C