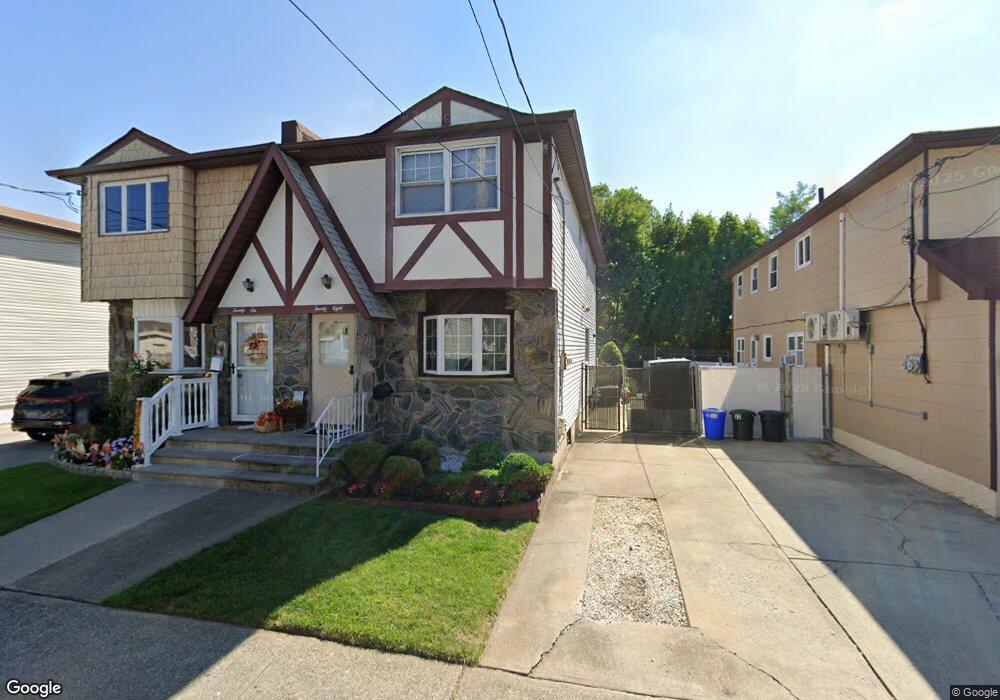
28 Behan Ct Staten Island, NY 10306
New Dorp NeighborhoodEstimated Value: $707,000 - $768,000
3
Beds
3
Baths
1,280
Sq Ft
$581/Sq Ft
Est. Value
About This Home
This home is located at 28 Behan Ct, Staten Island, NY 10306 and is currently estimated at $743,367, approximately $580 per square foot. 28 Behan Ct is a home located in Richmond County with nearby schools including P.S. 41 The Stephanie a Vierno School, Is 2 George L Egbert, and New Dorp High School.
Ownership History
Date
Name
Owned For
Owner Type
Purchase Details
Closed on
Sep 16, 2024
Sold by
Luo Wan Cheng and Lun Suiming
Bought by
Wancheng Luo And Suiming Lun Revocable Living and Luo
Current Estimated Value
Purchase Details
Closed on
Jan 12, 1998
Sold by
Hooker Gregory and Hooker Lisa
Bought by
Luo Wan Cheng and Lun Suiming
Home Financials for this Owner
Home Financials are based on the most recent Mortgage that was taken out on this home.
Original Mortgage
$138,000
Interest Rate
6.93%
Create a Home Valuation Report for This Property
The Home Valuation Report is an in-depth analysis detailing your home's value as well as a comparison with similar homes in the area
Home Values in the Area
Average Home Value in this Area
Purchase History
| Date | Buyer | Sale Price | Title Company |
|---|---|---|---|
| Wancheng Luo And Suiming Lun Revocable Living | -- | None Listed On Document | |
| Wancheng Luo And Suiming Lun Revocable Living | -- | None Listed On Document | |
| Luo Wan Cheng | $184,000 | -- |
Source: Public Records
Mortgage History
| Date | Status | Borrower | Loan Amount |
|---|---|---|---|
| Previous Owner | Luo Wan Cheng | $138,000 |
Source: Public Records
Tax History Compared to Growth
Tax History
| Year | Tax Paid | Tax Assessment Tax Assessment Total Assessment is a certain percentage of the fair market value that is determined by local assessors to be the total taxable value of land and additions on the property. | Land | Improvement |
|---|---|---|---|---|
| 2025 | $5,428 | $43,200 | $5,749 | $37,451 |
| 2024 | $5,440 | $39,420 | $6,187 | $33,233 |
| 2023 | $5,422 | $28,394 | $6,124 | $22,270 |
| 2022 | $4,797 | $32,340 | $8,580 | $23,760 |
| 2021 | $5,015 | $33,960 | $8,580 | $25,380 |
| 2020 | $4,809 | $34,980 | $8,580 | $26,400 |
| 2019 | $4,662 | $34,980 | $8,580 | $26,400 |
| 2018 | $4,526 | $23,662 | $6,891 | $16,771 |
| 2017 | $4,251 | $22,323 | $7,600 | $14,723 |
| 2016 | $3,900 | $21,060 | $8,580 | $12,480 |
| 2015 | $3,483 | $20,100 | $7,140 | $12,960 |
| 2014 | $3,483 | $19,740 | $7,140 | $12,600 |
Source: Public Records
Map
Nearby Homes