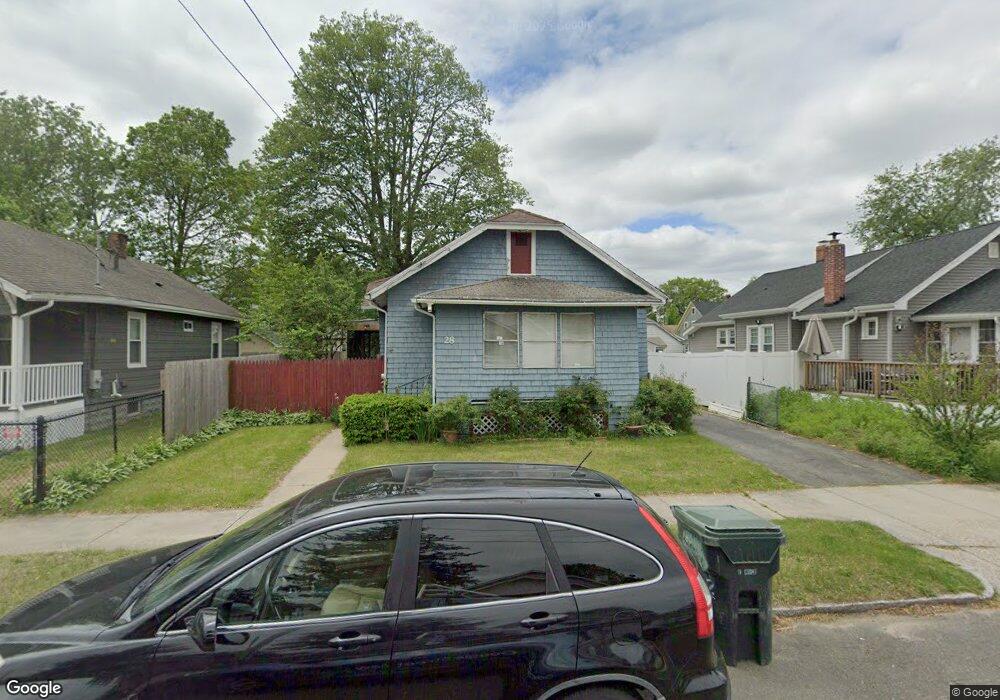
28 Berbay Cir Springfield, MA 01109
Pine Point NeighborhoodEstimated Value: $195,000 - $243,000
2
Beds
1
Bath
895
Sq Ft
$238/Sq Ft
Est. Value
About This Home
This home is located at 28 Berbay Cir, Springfield, MA 01109 and is currently estimated at $213,315, approximately $238 per square foot. 28 Berbay Cir is a home located in Hampden County with nearby schools including Hiram L. Dorman Elementary, John F. Kennedy Academy, and Springfield Central High School.
Ownership History
Date
Name
Owned For
Owner Type
Purchase Details
Closed on
Oct 26, 2023
Sold by
Harty Richard S Est and Harty
Bought by
Courageous Lion Llc and Altostratus Llc
Current Estimated Value
Home Financials for this Owner
Home Financials are based on the most recent Mortgage that was taken out on this home.
Original Mortgage
$1,749,249
Outstanding Balance
$1,716,817
Interest Rate
7.18%
Mortgage Type
Commercial
Estimated Equity
-$1,503,502
Purchase Details
Closed on
Apr 1, 2009
Sold by
Champion Mortgage
Bought by
Harty Richard S
Purchase Details
Closed on
Feb 2, 2007
Sold by
Watson Christine and Champion Mtg
Bought by
Champion Mtg
Purchase Details
Closed on
Mar 30, 2004
Sold by
Oconnell James H
Bought by
Watson William P
Home Financials for this Owner
Home Financials are based on the most recent Mortgage that was taken out on this home.
Original Mortgage
$72,000
Interest Rate
5.65%
Mortgage Type
Purchase Money Mortgage
Create a Home Valuation Report for This Property
The Home Valuation Report is an in-depth analysis detailing your home's value as well as a comparison with similar homes in the area
Home Values in the Area
Average Home Value in this Area
Purchase History
| Date | Buyer | Sale Price | Title Company |
|---|---|---|---|
| Courageous Lion Llc | $1,729,500 | None Available | |
| Harty Richard S | $40,000 | -- | |
| Champion Mtg | $117,997 | -- | |
| Watson William P | $90,000 | -- |
Source: Public Records
Mortgage History
| Date | Status | Borrower | Loan Amount |
|---|---|---|---|
| Open | Courageous Lion Llc | $1,749,249 | |
| Previous Owner | Watson William P | $72,000 |
Source: Public Records
Tax History
| Year | Tax Paid | Tax Assessment Tax Assessment Total Assessment is a certain percentage of the fair market value that is determined by local assessors to be the total taxable value of land and additions on the property. | Land | Improvement |
|---|---|---|---|---|
| 2025 | $2,159 | $137,700 | $39,000 | $98,700 |
| 2024 | $3,087 | $192,200 | $32,500 | $159,700 |
| 2023 | $2,747 | $161,100 | $29,500 | $131,600 |
| 2022 | $2,539 | $134,900 | $27,600 | $107,300 |
| 2021 | $2,381 | $126,000 | $25,100 | $100,900 |
| 2020 | $2,318 | $118,700 | $25,100 | $93,600 |
| 2019 | $2,267 | $115,200 | $25,100 | $90,100 |
| 2018 | $1,931 | $98,100 | $25,100 | $73,000 |
| 2017 | $1,915 | $97,400 | $23,200 | $74,200 |
| 2016 | $1,821 | $92,600 | $23,200 | $69,400 |
| 2015 | $1,768 | $89,900 | $23,200 | $66,700 |
Source: Public Records
Map
Nearby Homes
Your Personal Tour Guide
Ask me questions while you tour the home.