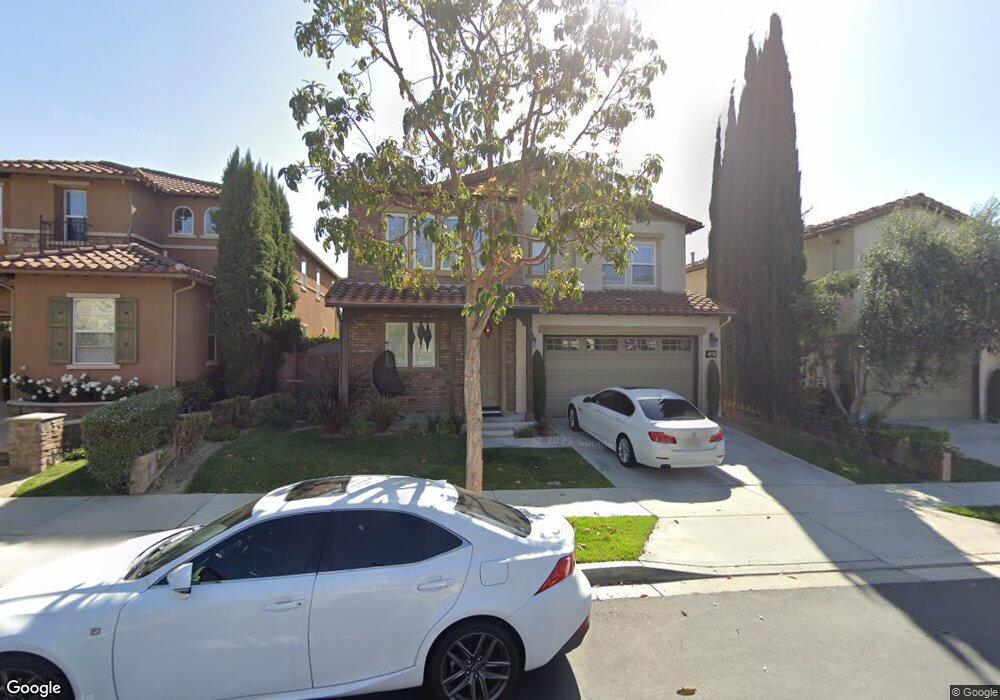
28 Cabrillo Terrace Aliso Viejo, CA 92656
Estimated Value: $1,907,190 - $2,487,000
5
Beds
5
Baths
3,344
Sq Ft
$652/Sq Ft
Est. Value
About This Home
This home is located at 28 Cabrillo Terrace, Aliso Viejo, CA 92656 and is currently estimated at $2,180,548, approximately $652 per square foot. 28 Cabrillo Terrace is a home located in Orange County with nearby schools including Oak Grove Elementary School, Aliso Viejo Middle School, and Aliso Niguel High School.
Ownership History
Date
Name
Owned For
Owner Type
Purchase Details
Closed on
May 26, 2023
Sold by
Hegazy Mohamed
Bought by
2007 Hegazy Family Trust
Current Estimated Value
Purchase Details
Closed on
Mar 23, 2012
Sold by
Hegazy Mohamed and Tawfik Mona S
Bought by
Hegaz Mohamed and Tawfik Mona S
Home Financials for this Owner
Home Financials are based on the most recent Mortgage that was taken out on this home.
Original Mortgage
$625,000
Interest Rate
3.83%
Mortgage Type
New Conventional
Purchase Details
Closed on
Aug 20, 2009
Sold by
Shea Homes Limited Partnership
Bought by
Hegazy Mohamed and Tawfik Mona
Home Financials for this Owner
Home Financials are based on the most recent Mortgage that was taken out on this home.
Original Mortgage
$729,750
Interest Rate
5.09%
Mortgage Type
New Conventional
Create a Home Valuation Report for This Property
The Home Valuation Report is an in-depth analysis detailing your home's value as well as a comparison with similar homes in the area
Home Values in the Area
Average Home Value in this Area
Purchase History
| Date | Buyer | Sale Price | Title Company |
|---|---|---|---|
| 2007 Hegazy Family Trust | -- | None Listed On Document | |
| 2007 Hegazy Family Trust | -- | None Listed On Document | |
| Hegaz Mohamed | -- | Fidelity National Title Co | |
| Hegazy Mohamed | $954,000 | Chicago Title Company |
Source: Public Records
Mortgage History
| Date | Status | Borrower | Loan Amount |
|---|---|---|---|
| Previous Owner | Hegaz Mohamed | $625,000 | |
| Previous Owner | Hegazy Mohamed | $729,750 |
Source: Public Records
Tax History Compared to Growth
Tax History
| Year | Tax Paid | Tax Assessment Tax Assessment Total Assessment is a certain percentage of the fair market value that is determined by local assessors to be the total taxable value of land and additions on the property. | Land | Improvement |
|---|---|---|---|---|
| 2025 | $18,058 | $1,231,440 | $497,253 | $734,187 |
| 2024 | $18,058 | $1,207,295 | $487,503 | $719,792 |
| 2023 | $18,326 | $1,183,623 | $477,944 | $705,679 |
| 2022 | $18,442 | $1,160,415 | $468,572 | $691,843 |
| 2021 | $17,657 | $1,137,662 | $459,384 | $678,278 |
| 2020 | $17,156 | $1,125,997 | $454,673 | $671,324 |
| 2019 | $17,061 | $1,103,919 | $445,758 | $658,161 |
| 2018 | $16,745 | $1,082,274 | $437,018 | $645,256 |
| 2017 | $16,498 | $1,061,053 | $428,449 | $632,604 |
| 2016 | $16,162 | $1,040,249 | $420,049 | $620,200 |
| 2015 | $17,095 | $1,024,624 | $413,739 | $610,885 |
| 2014 | $16,870 | $1,004,554 | $405,635 | $598,919 |
Source: Public Records
Map
Nearby Homes
- 40 Golf Dr
- 17 Via Athena Unit 49
- 34 Via Bacchus
- 106 Via Athena
- 25 Via Falerno Unit 19
- 24811 Via San Marco
- 8 Ashwood
- 23401 Via San Miguel
- 23356 Via San Miguel
- 15 Elmbrook Unit 52
- 4023 Calle Sonora Este
- 753 Avenida Majorca Unit A
- 11 Summerwood
- 6 Summerwood
- 465 Avenida Sevilla Unit P
- 465 Avenida Sevilla Unit C
- 754 Avenida Majorca Unit A
- 442 Avenida Sevilla Unit A
- 4018 Calle Sonora Este
- 4025 Calle Sonora Este Unit 2C
- 30 Cabrillo Terrace
- 26 Cabrillo Terrace
- 24 Cabrillo Terrace
- 32 Cabrillo Terrace
- 22 Cabrillo Terrace
- 34 Cabrillo Terrace
- 35 Cabrillo Terrace
- 35 Cabrillo Terrace
- 37 Cabrillo Terrace
- 33 San Marcos Ln
- 39 Cabrillo Terrace
- 35 San Marcos Ln
- 41 Cabrillo Terrace
- 36 Cabrillo Terrace
- 20 Cabrillo Terrace
- 29 Cabrillo Terrace
- 29 San Marcos Ln
- 43 Cabrillo Terrace
- 27 Cabrillo Terrace
- 45 Cabrillo Terrace