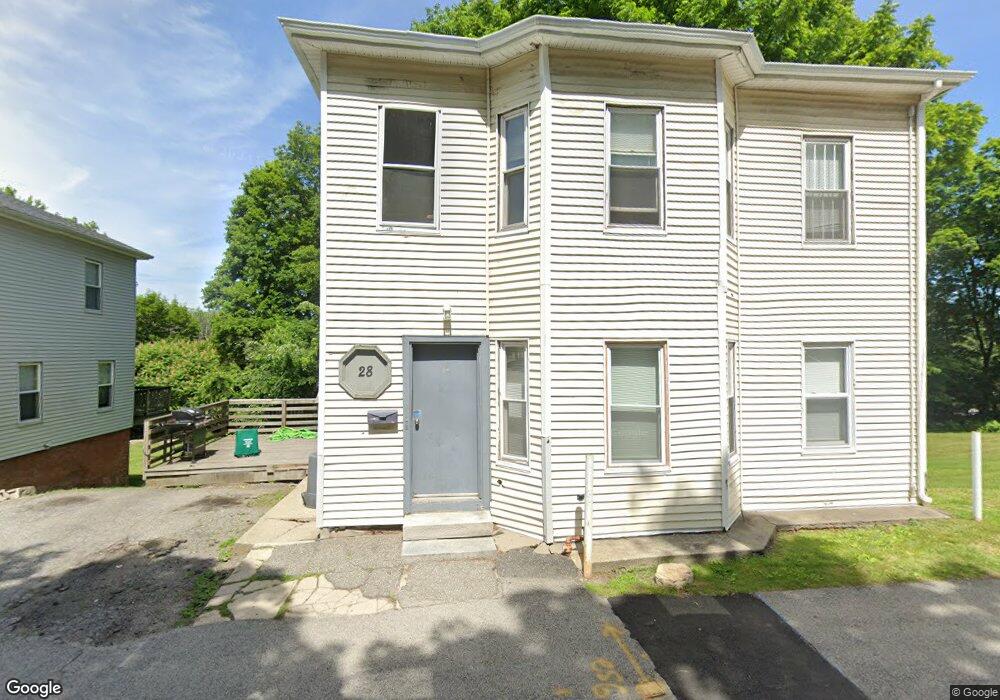
28 Caro St Worcester, MA 01610
College Hill NeighborhoodEstimated Value: $341,518 - $654,000
5
Beds
3
Baths
1,750
Sq Ft
$299/Sq Ft
Est. Value
About This Home
This home is located at 28 Caro St, Worcester, MA 01610 and is currently estimated at $522,880, approximately $298 per square foot. 28 Caro St is a home located in Worcester County with nearby schools including Jacob Hiatt Magnet School, Chandler Magnet, and Heard Street Discovery Academy.
Ownership History
Date
Name
Owned For
Owner Type
Purchase Details
Closed on
Dec 28, 2012
Sold by
Hicgo Corp
Bought by
Hicgo Rt and Vanincasa Steven
Current Estimated Value
Purchase Details
Closed on
Jul 26, 2012
Sold by
Tallage Llc
Bought by
Hicgo Corp
Purchase Details
Closed on
Jan 15, 2003
Sold by
Lemire Kevin M
Bought by
Gagne Michele
Home Financials for this Owner
Home Financials are based on the most recent Mortgage that was taken out on this home.
Original Mortgage
$216,000
Interest Rate
6.18%
Mortgage Type
Purchase Money Mortgage
Purchase Details
Closed on
Apr 17, 1991
Sold by
Perreault Norman J
Bought by
Lemire Kevin M
Home Financials for this Owner
Home Financials are based on the most recent Mortgage that was taken out on this home.
Original Mortgage
$79,200
Interest Rate
9.4%
Mortgage Type
Purchase Money Mortgage
Create a Home Valuation Report for This Property
The Home Valuation Report is an in-depth analysis detailing your home's value as well as a comparison with similar homes in the area
Home Values in the Area
Average Home Value in this Area
Purchase History
| Date | Buyer | Sale Price | Title Company |
|---|---|---|---|
| Hicgo Rt | -- | -- | |
| Hicgo Corp | $150,000 | -- | |
| Gagne Michele | $270,000 | -- | |
| Lemire Kevin M | $110,000 | -- |
Source: Public Records
Mortgage History
| Date | Status | Borrower | Loan Amount |
|---|---|---|---|
| Open | Lemire Kevin M | $175,000 | |
| Previous Owner | Lemire Kevin M | $216,000 | |
| Previous Owner | Lemire Kevin M | $79,200 |
Source: Public Records
Tax History
| Year | Tax Paid | Tax Assessment Tax Assessment Total Assessment is a certain percentage of the fair market value that is determined by local assessors to be the total taxable value of land and additions on the property. | Land | Improvement |
|---|---|---|---|---|
| 2025 | $5,706 | $432,600 | $97,600 | $335,000 |
| 2024 | $5,591 | $406,600 | $97,600 | $309,000 |
| 2023 | $5,171 | $360,600 | $84,900 | $275,700 |
| 2022 | $4,634 | $304,700 | $67,900 | $236,800 |
| 2021 | $3,777 | $232,000 | $54,300 | $177,700 |
| 2020 | $3,437 | $202,200 | $53,900 | $148,300 |
| 2019 | $3,517 | $195,400 | $47,100 | $148,300 |
| 2018 | $3,580 | $189,300 | $47,100 | $142,200 |
| 2017 | $3,413 | $177,600 | $47,100 | $130,500 |
| 2016 | $2,770 | $134,400 | $33,300 | $101,100 |
| 2015 | $2,697 | $134,400 | $33,300 | $101,100 |
| 2014 | $2,626 | $134,400 | $33,300 | $101,100 |
Source: Public Records
Map
Nearby Homes
- 47 Malvern Rd
- 407 Cambridge St Unit 1
- 6 Epworth St
- 1034 Southbridge St
- 20 Washburn St
- 73 Sophia Dr
- 607 Cambridge St Unit 4
- 50 Sophia Dr
- 103 Illinois St
- 22 Bittersweet Blvd
- 52 Richards St
- 56 Richards St
- 54 Richards St
- 83 Canterbury St
- 3A Gediminas St
- 26 Maxwell St
- 6 Beckman St
- 172 Perry Ave Unit 1A
- 172 Perry Ave Unit 2B
- 18 Crystal St
- 28 Caro St Unit 1
- 26 Caro St
- 32 Caro St
- 858 Southbridge St
- 29 Caro St
- 25 Caro St
- 31 Caro St
- 27 Caro St
- 38 Caro St
- 38 Caro St Unit 3
- 36 Caro St
- 21 Caro St
- 21 Caro St Unit 2
- 860 Southbridge St Unit 11
- 860 Southbridge St Unit 10
- 860 Southbridge St Unit 9
- 860 Southbridge St Unit 8
- 860 Southbridge St Unit 7
- 860 Southbridge St Unit 6
- 860 Southbridge St Unit 5
Your Personal Tour Guide
Ask me questions while you tour the home.