Estimated Value: $1,558,602 - $2,060,000
4
Beds
4
Baths
4,019
Sq Ft
$447/Sq Ft
Est. Value
About This Home
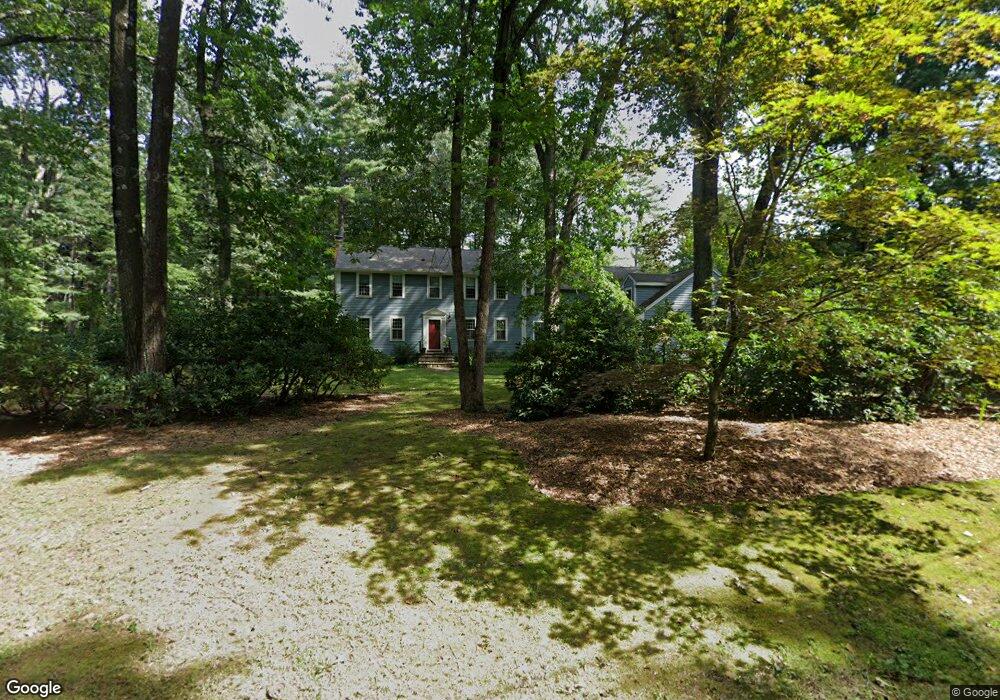
This home is located at 28 Chickering Dr, Dover, MA 02030 and is currently estimated at $1,797,151, approximately $447 per square foot. 28 Chickering Dr is a home located in Norfolk County with nearby schools including Chickering Elementary School, Dover-Sherborn Regional Middle School, and Dover-Sherborn Regional High School.
Ownership History
Date
Name
Owned For
Owner Type
Purchase Details
Closed on
Oct 16, 2014
Sold by
Salvin Joshua and Mcbride Sarah
Bought by
Mcbride Sarah
Current Estimated Value
Home Financials for this Owner
Home Financials are based on the most recent Mortgage that was taken out on this home.
Original Mortgage
$840,000
Outstanding Balance
$634,079
Interest Rate
4%
Mortgage Type
Adjustable Rate Mortgage/ARM
Estimated Equity
$1,163,072
Purchase Details
Closed on
Jun 22, 2007
Sold by
Ruysdeperez Charles A and Ruysdeperez Kim F
Bought by
Salvin Joshua and Mcbride Sarah
Home Financials for this Owner
Home Financials are based on the most recent Mortgage that was taken out on this home.
Original Mortgage
$832,000
Interest Rate
6.14%
Mortgage Type
Purchase Money Mortgage
Purchase Details
Closed on
Aug 14, 1992
Sold by
Griffing George T and Griffing Bonnie A B
Bought by
Ruys Deperez Charles A and Ruys Deperez Kim F
Create a Home Valuation Report for This Property
The Home Valuation Report is an in-depth analysis detailing your home's value as well as a comparison with similar homes in the area
Home Values in the Area
Average Home Value in this Area
Purchase History
| Date | Buyer | Sale Price | Title Company |
|---|---|---|---|
| Mcbride Sarah | -- | -- | |
| Salvin Joshua | $1,040,000 | -- | |
| Ruys Deperez Charles A | $537,500 | -- |
Source: Public Records
Mortgage History
| Date | Status | Borrower | Loan Amount |
|---|---|---|---|
| Open | Mcbride Sarah | $840,000 | |
| Previous Owner | Salvin Joshua | $832,000 | |
| Previous Owner | Ruys Deperez Charles A | $422,000 |
Source: Public Records
Tax History
| Year | Tax Paid | Tax Assessment Tax Assessment Total Assessment is a certain percentage of the fair market value that is determined by local assessors to be the total taxable value of land and additions on the property. | Land | Improvement |
|---|---|---|---|---|
| 2025 | $14,394 | $1,277,200 | $642,700 | $634,500 |
| 2024 | $13,308 | $1,214,200 | $620,900 | $593,300 |
| 2023 | $13,221 | $1,084,600 | $544,700 | $539,900 |
| 2022 | $12,386 | $997,300 | $522,900 | $474,400 |
| 2021 | $12,630 | $979,800 | $522,900 | $456,900 |
| 2020 | $12,581 | $979,800 | $522,900 | $456,900 |
| 2019 | $12,669 | $979,800 | $522,900 | $456,900 |
| 2018 | $12,351 | $961,900 | $522,900 | $439,000 |
| 2017 | $12,159 | $931,700 | $479,300 | $452,400 |
| 2016 | $12,000 | $931,700 | $479,300 | $452,400 |
| 2015 | $11,359 | $894,400 | $455,400 | $439,000 |
Source: Public Records
Map
Nearby Homes
- 62 Claybrook Rd
- 60 Claybrook Rd
- 3 Riverside Dr
- 42 Troutbrook Rd
- 4 Claybrook Rd
- 1 Old Colony Dr
- 1780 Central Ave
- 365 Charles River St
- 55 Willow St
- 46 Charles River St
- 68 Locust Ln
- 34 Stratford Rd
- 84 Pleasant St
- 1 Mill St
- 37 Carleton Dr
- 8 Crestview Rd
- 25 Bretton Rd
- 389 Grove St
- 182 Winding River Rd
- 9 Buttercup Ln
Your Personal Tour Guide
Ask me questions while you tour the home.