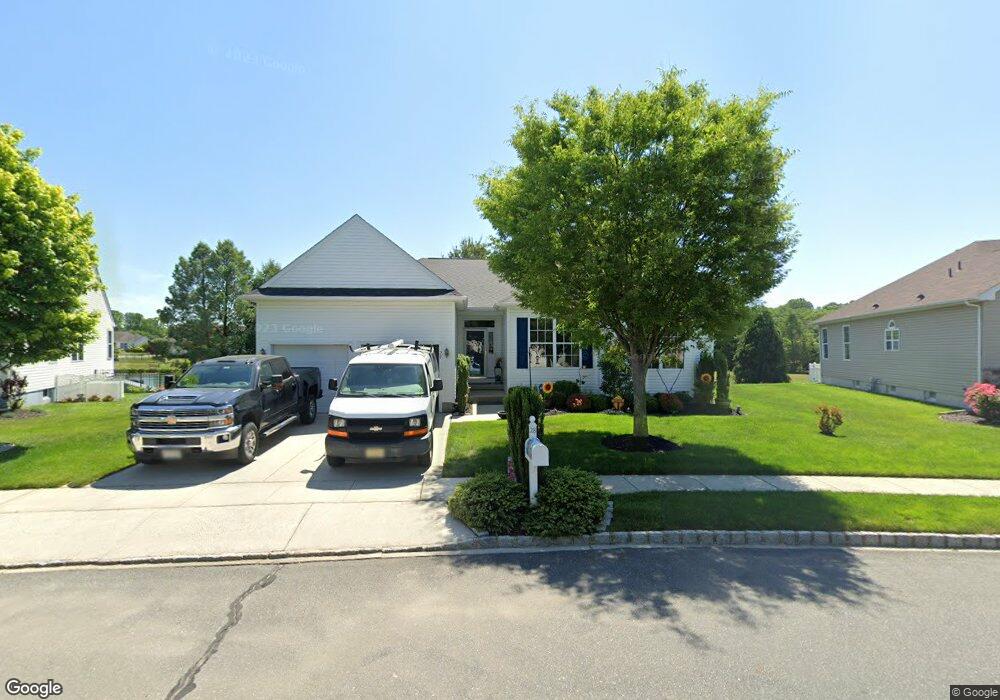
28 Chrissy Way Sicklerville, NJ 08081
Erial NeighborhoodEstimated Value: $436,320 - $489,000
--
Bed
--
Bath
1,936
Sq Ft
$241/Sq Ft
Est. Value
About This Home
This home is located at 28 Chrissy Way, Sicklerville, NJ 08081 and is currently estimated at $467,330, approximately $241 per square foot. 28 Chrissy Way is a home located in Camden County with nearby schools including Timber Creek High School and Erial Community Church Christian School.
Ownership History
Date
Name
Owned For
Owner Type
Purchase Details
Closed on
Jun 4, 2013
Sold by
Maneen Richard S and Maneen Maria A
Bought by
Maneen Maria A
Current Estimated Value
Purchase Details
Closed on
Oct 22, 2010
Sold by
Lansberry Richard B and Lansberry Kathleen M
Bought by
Maneen Richard S and Maneen Maria A
Purchase Details
Closed on
Aug 31, 2006
Sold by
Arakelian Arthur
Bought by
Lansberry Richard B and Lansberry Kathleen M
Purchase Details
Closed on
Jun 18, 2002
Sold by
Group Ten Builders Llc
Bought by
Arakelian Arthur and Arakelian Marian A
Create a Home Valuation Report for This Property
The Home Valuation Report is an in-depth analysis detailing your home's value as well as a comparison with similar homes in the area
Home Values in the Area
Average Home Value in this Area
Purchase History
| Date | Buyer | Sale Price | Title Company |
|---|---|---|---|
| Maneen Maria A | -- | None Available | |
| Maneen Richard S | $245,000 | -- | |
| Lansberry Richard B | $319,000 | -- | |
| Arakelian Arthur | $193,725 | -- |
Source: Public Records
Tax History Compared to Growth
Tax History
| Year | Tax Paid | Tax Assessment Tax Assessment Total Assessment is a certain percentage of the fair market value that is determined by local assessors to be the total taxable value of land and additions on the property. | Land | Improvement |
|---|---|---|---|---|
| 2025 | $9,462 | $221,600 | $47,300 | $174,300 |
| 2024 | $9,201 | $221,600 | $47,300 | $174,300 |
| 2023 | $9,201 | $221,600 | $47,300 | $174,300 |
| 2022 | $9,143 | $221,600 | $47,300 | $174,300 |
| 2021 | $8,942 | $221,600 | $47,300 | $174,300 |
| 2020 | $8,935 | $221,600 | $47,300 | $174,300 |
| 2019 | $8,751 | $221,600 | $47,300 | $174,300 |
| 2018 | $8,718 | $221,600 | $47,300 | $174,300 |
| 2017 | $8,436 | $221,600 | $47,300 | $174,300 |
| 2016 | $8,255 | $221,600 | $47,300 | $174,300 |
| 2015 | $7,665 | $221,600 | $47,300 | $174,300 |
| 2014 | $7,614 | $221,600 | $47,300 | $174,300 |
Source: Public Records
Map
Nearby Homes