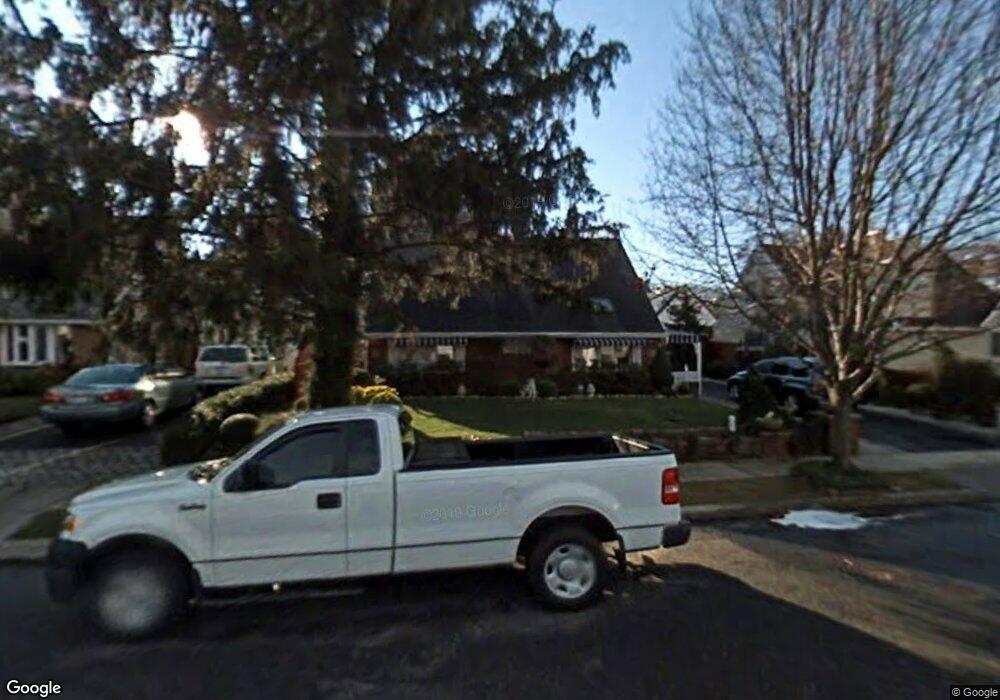
28 Collins Rd Glen Cove, NY 11542
Estimated Value: $991,856 - $1,070,000
6
Beds
3
Baths
2,350
Sq Ft
$439/Sq Ft
Est. Value
About This Home
This home is located at 28 Collins Rd, Glen Cove, NY 11542 and is currently estimated at $1,030,928, approximately $438 per square foot. 28 Collins Rd is a home located in Nassau County with nearby schools including North Shore Middle School, North Shore Senior High School, and Friends Academy.
Ownership History
Date
Name
Owned For
Owner Type
Purchase Details
Closed on
Jan 14, 2016
Sold by
Boldi Francine and Boldi Francine Revocable Livin
Bought by
T28 Collins Corp
Current Estimated Value
Home Financials for this Owner
Home Financials are based on the most recent Mortgage that was taken out on this home.
Original Mortgage
$442,400
Outstanding Balance
$390,686
Interest Rate
8%
Mortgage Type
Commercial
Estimated Equity
$640,242
Purchase Details
Closed on
Feb 19, 1998
Create a Home Valuation Report for This Property
The Home Valuation Report is an in-depth analysis detailing your home's value as well as a comparison with similar homes in the area
Home Values in the Area
Average Home Value in this Area
Purchase History
| Date | Buyer | Sale Price | Title Company |
|---|---|---|---|
| T28 Collins Corp | $632,000 | Island Abstract Inc | |
| -- | -- | -- |
Source: Public Records
Mortgage History
| Date | Status | Borrower | Loan Amount |
|---|---|---|---|
| Open | T28 Collins Corp | $442,400 |
Source: Public Records
Tax History Compared to Growth
Tax History
| Year | Tax Paid | Tax Assessment Tax Assessment Total Assessment is a certain percentage of the fair market value that is determined by local assessors to be the total taxable value of land and additions on the property. | Land | Improvement |
|---|---|---|---|---|
| 2025 | $16,495 | $672 | $224 | $448 |
| 2024 | $5,324 | $658 | $219 | $439 |
| 2023 | $15,676 | $672 | $224 | $448 |
| 2022 | $15,676 | $672 | $224 | $448 |
| 2021 | $14,945 | $666 | $222 | $444 |
| 2020 | $14,552 | $1,000 | $698 | $302 |
| 2019 | $13,596 | $1,000 | $698 | $302 |
| 2018 | $12,865 | $1,000 | $0 | $0 |
| 2017 | $6,474 | $1,000 | $659 | $341 |
| 2016 | $10,786 | $1,059 | $571 | $488 |
| 2015 | $4,334 | $1,118 | $603 | $515 |
| 2014 | $4,334 | $1,118 | $603 | $515 |
| 2013 | $4,549 | $1,294 | $698 | $596 |
Source: Public Records
Map
Nearby Homes