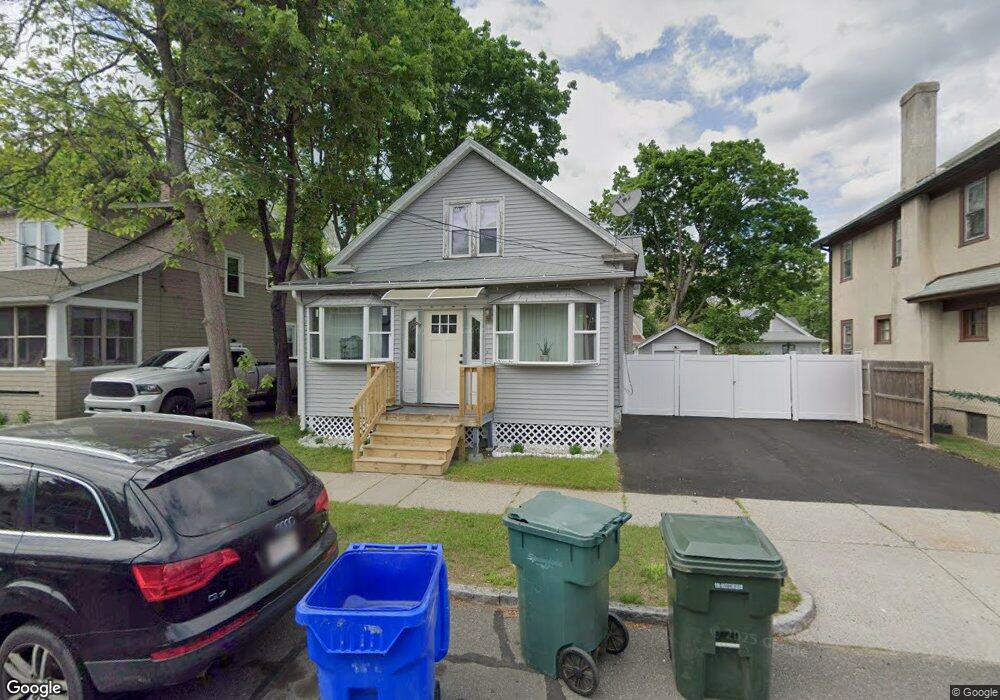
28 Crest St Springfield, MA 01109
Upper Hill NeighborhoodEstimated Value: $238,000 - $274,000
2
Beds
2
Baths
1,091
Sq Ft
$233/Sq Ft
Est. Value
About This Home
This home is located at 28 Crest St, Springfield, MA 01109 and is currently estimated at $254,622, approximately $233 per square foot. 28 Crest St is a home located in Hampden County with nearby schools including Homer Street Elementary School, John J Duggan Middle, and Springfield High School of Science and Technology.
Ownership History
Date
Name
Owned For
Owner Type
Purchase Details
Closed on
Mar 26, 2025
Sold by
Trabal Anthony
Bought by
Trabal Anthony
Current Estimated Value
Home Financials for this Owner
Home Financials are based on the most recent Mortgage that was taken out on this home.
Original Mortgage
$225,000
Outstanding Balance
$223,653
Interest Rate
6.87%
Mortgage Type
Purchase Money Mortgage
Estimated Equity
$30,969
Purchase Details
Closed on
Dec 29, 1998
Sold by
Fnma
Bought by
Trabal Anthony
Home Financials for this Owner
Home Financials are based on the most recent Mortgage that was taken out on this home.
Original Mortgage
$30,600
Interest Rate
6.89%
Mortgage Type
Purchase Money Mortgage
Purchase Details
Closed on
Apr 9, 1998
Sold by
Riley John T and Riley Amy L
Bought by
Federal National Mortgage Association
Purchase Details
Closed on
Jul 20, 1993
Sold by
Corbin Stephen S
Bought by
Riley John T and Riley Amy L
Home Financials for this Owner
Home Financials are based on the most recent Mortgage that was taken out on this home.
Original Mortgage
$66,500
Interest Rate
7.4%
Mortgage Type
Purchase Money Mortgage
Create a Home Valuation Report for This Property
The Home Valuation Report is an in-depth analysis detailing your home's value as well as a comparison with similar homes in the area
Home Values in the Area
Average Home Value in this Area
Purchase History
| Date | Buyer | Sale Price | Title Company |
|---|---|---|---|
| Trabal Anthony | $250,000 | None Available | |
| Trabal Anthony | $250,000 | None Available | |
| Trabal Anthony | $34,000 | -- | |
| Trabal Anthony | $34,000 | -- | |
| Federal National Mortgage Association | $36,000 | -- | |
| Federal National Mortgage Association | $36,000 | -- | |
| Riley John T | $70,000 | -- | |
| Riley John T | $70,000 | -- |
Source: Public Records
Mortgage History
| Date | Status | Borrower | Loan Amount |
|---|---|---|---|
| Open | Trabal Anthony | $225,000 | |
| Closed | Trabal Anthony | $225,000 | |
| Previous Owner | Riley John T | $30,600 | |
| Previous Owner | Riley John T | $66,500 |
Source: Public Records
Tax History
| Year | Tax Paid | Tax Assessment Tax Assessment Total Assessment is a certain percentage of the fair market value that is determined by local assessors to be the total taxable value of land and additions on the property. | Land | Improvement |
|---|---|---|---|---|
| 2025 | $2,959 | $188,700 | $39,000 | $149,700 |
| 2024 | $2,774 | $172,700 | $32,500 | $140,200 |
| 2023 | $2,893 | $169,700 | $29,500 | $140,200 |
| 2022 | $2,388 | $126,900 | $27,600 | $99,300 |
| 2021 | $2,485 | $131,500 | $25,100 | $106,400 |
| 2020 | $2,515 | $128,800 | $25,100 | $103,700 |
| 2019 | $2,222 | $112,900 | $25,100 | $87,800 |
| 2018 | $2,043 | $103,800 | $25,100 | $78,700 |
| 2017 | $1,992 | $101,300 | $23,200 | $78,100 |
| 2016 | $1,809 | $92,000 | $23,200 | $68,800 |
| 2015 | $1,745 | $88,700 | $14,500 | $74,200 |
Source: Public Records
Map
Nearby Homes
- 87 Fenwick St
- 11 Ina St
- 867 Roosevelt Ave
- 111 Marlborough St
- 62-64 Bristol St
- 135-137 Suffolk St
- 283 Wilbraham Rd
- 236 Pondview Dr
- 48-50 Dresden St
- 124-126 Westford Cir
- 67 Villa Pkwy
- 0 NS (24) Alden St
- 27 Nokomis St
- 21 Westford Cir
- 19 Westford Ave
- 54 S Shore Dr
- 22 Amanda St
- 178 Penrose St
- 23 Eldert St
- 44 Amanda St
- 24 Crest St
- 34 Crest St
- 18 Crest St
- 27 Highland St
- 23 Highland St
- 33 Highland St
- 17 Highland St Unit 19
- 37 Highland St
- 14 Crest St
- 25 Crest St
- 21 Crest St
- 33 Crest St
- 37 Crest St
- 11 Highland St Unit 15
- 17 Crest St
- 37 Crest St
- 42 Lakeside St Unit 44
- 42-44 Lakeside St
- 46 Lakeside St
- 36 Lakeside St Unit 38
Your Personal Tour Guide
Ask me questions while you tour the home.