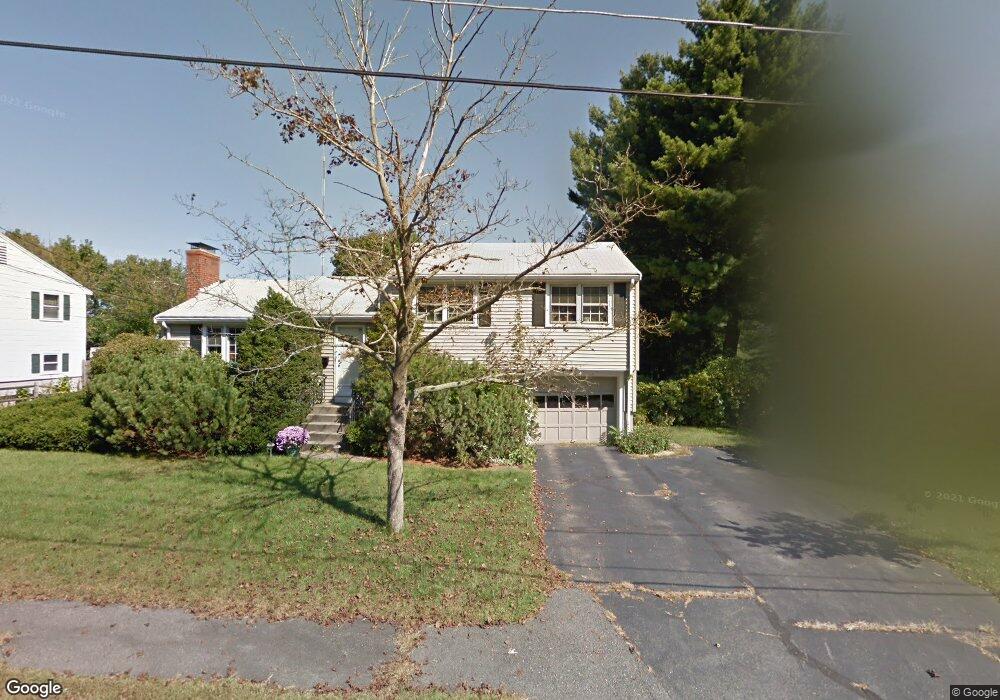
28 David Rd Needham Heights, MA 02494
Estimated Value: $955,000 - $1,226,846
About This Home
This home is located at 28 David Rd, Needham Heights, MA 02494 and is currently estimated at $1,104,962, approximately $920 per square foot. 28 David Rd is a home located in Norfolk County with nearby schools including Eliot Elementary School, High Rock Middle School, and Pollard Middle School.
Ownership History
We collect this data history from publicly available records. To have your information removed, we recommend requesting removal directly through your county’s website.
Purchase Details
Home Financials for this Owner
Home Financials are based on the most recent Mortgage that was taken out on this home.Purchase Details
Home Values in the Area
Average Home Value in this Area
Purchase History
We collect this data history from publicly available records. To have your information removed, we recommend requesting removal directly through your county’s website.
| Date | Buyer | Sale Price | Title Company |
|---|---|---|---|
| $225,500 | -- | ||
| $225,500 | -- | ||
| $237,000 | -- |
Mortgage History
We collect this data history from publicly available records. To have your information removed, we recommend requesting removal directly through your county’s website.
| Date | Status | Borrower | Loan Amount |
|---|---|---|---|
| Open | $171,000 | ||
| Closed | $50,000 | ||
| Closed | $180,400 |
Tax History
We collect this data history from publicly available records. To have your information removed, we recommend requesting removal directly through your county’s website.
| Year | Tax Paid | Tax Assessment Tax Assessment Total Assessment is a certain percentage of the fair market value that is determined by local assessors to be the total taxable value of land and additions on the property. | Land | Improvement |
|---|---|---|---|---|
| 2025 | $9,435 | $890,100 | $670,300 | $219,800 |
| 2024 | $8,387 | $669,900 | $480,500 | $189,400 |
| 2023 | $8,546 | $655,400 | $480,500 | $174,900 |
| 2022 | $7,982 | $597,000 | $429,000 | $168,000 |
| 2021 | $7,779 | $597,000 | $429,000 | $168,000 |
| 2020 | $7,509 | $601,200 | $429,000 | $172,200 |
| 2019 | $6,946 | $560,600 | $390,000 | $170,600 |
| 2018 | $6,660 | $560,600 | $390,000 | $170,600 |
| 2017 | $6,405 | $538,700 | $390,000 | $148,700 |
| 2016 | $6,217 | $538,700 | $390,000 | $148,700 |
| 2015 | $6,082 | $538,700 | $390,000 | $148,700 |
| 2014 | $5,485 | $471,200 | $325,000 | $146,200 |
Map
- 108 Woodbine Cir
- 100 Woodbine Cir
- 70 Woodbine Cir
- 143 Hunting Rd
- 42 Woodbine Cir
- 23 Yale Rd
- 29 Parker Rd
- 4 Park River St
- 48 Gary Rd
- 134 Hillside Ave Unit 134
- 140 Hillside Ave
- 140 Hillside Ave Unit a
- 11 Greenough St
- 96 Richdale Rd
- 23 Cheney St
- 18 Avon Cir
- 30 Webster St Unit 3
- 300 Hunnewell St
- 1175 Chestnut St Unit 12
- 490 Webster St
Ask me questions while you tour the home.