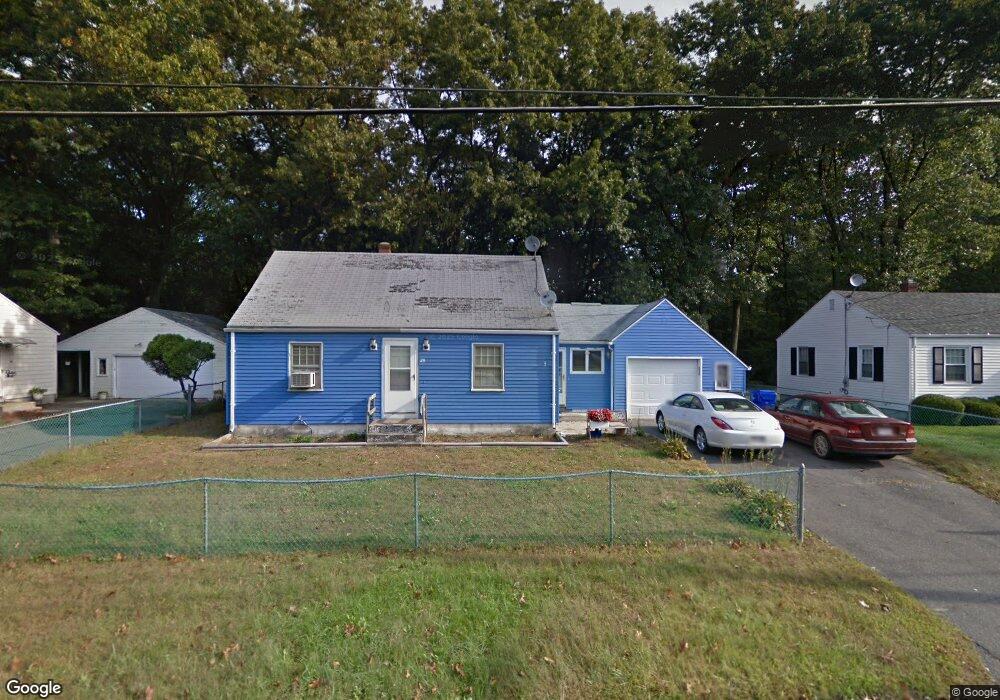
28 Duffy Ln Springfield, MA 01119
Pine Point NeighborhoodEstimated Value: $277,000 - $290,000
3
Beds
1
Bath
876
Sq Ft
$325/Sq Ft
Est. Value
About This Home
This home is located at 28 Duffy Ln, Springfield, MA 01119 and is currently estimated at $284,882, approximately $325 per square foot. 28 Duffy Ln is a home located in Hampden County with nearby schools including Thomas M Balliet Elementary School, John J Duggan Middle, and Springfield Central High School.
Ownership History
Date
Name
Owned For
Owner Type
Purchase Details
Closed on
Jul 11, 2003
Sold by
Serafino Andrew J and Montanari Nicole M
Bought by
Kelly Carol and Kelly David M
Current Estimated Value
Home Financials for this Owner
Home Financials are based on the most recent Mortgage that was taken out on this home.
Original Mortgage
$118,600
Outstanding Balance
$51,144
Interest Rate
5.45%
Mortgage Type
Purchase Money Mortgage
Estimated Equity
$233,738
Purchase Details
Closed on
Dec 29, 1999
Sold by
Est Bell Josephine W and Dulude Alice
Bought by
Serafino Andrew J and Montanari Nicole M
Home Financials for this Owner
Home Financials are based on the most recent Mortgage that was taken out on this home.
Original Mortgage
$72,393
Interest Rate
7.71%
Mortgage Type
Purchase Money Mortgage
Create a Home Valuation Report for This Property
The Home Valuation Report is an in-depth analysis detailing your home's value as well as a comparison with similar homes in the area
Home Values in the Area
Average Home Value in this Area
Purchase History
| Date | Buyer | Sale Price | Title Company |
|---|---|---|---|
| Kelly Carol | $118,600 | -- | |
| Serafino Andrew J | $73,000 | -- |
Source: Public Records
Mortgage History
| Date | Status | Borrower | Loan Amount |
|---|---|---|---|
| Open | Kelly Carol | $118,600 | |
| Previous Owner | Serafino Andrew J | $5,400 | |
| Previous Owner | Serafino Andrew J | $72,393 |
Source: Public Records
Tax History Compared to Growth
Tax History
| Year | Tax Paid | Tax Assessment Tax Assessment Total Assessment is a certain percentage of the fair market value that is determined by local assessors to be the total taxable value of land and additions on the property. | Land | Improvement |
|---|---|---|---|---|
| 2025 | $3,298 | $210,300 | $39,000 | $171,300 |
| 2024 | $3,308 | $206,000 | $39,000 | $167,000 |
| 2023 | $2,948 | $172,900 | $34,500 | $138,400 |
| 2022 | $2,819 | $149,800 | $32,300 | $117,500 |
| 2021 | $2,419 | $128,000 | $29,300 | $98,700 |
| 2020 | $2,529 | $129,500 | $29,300 | $100,200 |
| 2019 | $2,348 | $119,300 | $30,400 | $88,900 |
| 2018 | $2,328 | $118,300 | $30,400 | $87,900 |
| 2017 | $2,367 | $120,400 | $33,400 | $87,000 |
| 2016 | $2,259 | $114,900 | $33,400 | $81,500 |
| 2015 | $2,219 | $112,800 | $33,400 | $79,400 |
Source: Public Records
Map
Nearby Homes
- 195 Almira Rd
- 55 Woodrow St
- 35 Juniper Dr
- 188 Gilbert Ave
- 99 Rosewell St
- 64 Wilmington St
- 21 Meadowlark Ln
- 523 Boston Rd
- 6 Sparrow Dr
- 543 Boston Rd
- 55 Pheland St
- 98 Granger St
- 150 Seymour Ave
- 34 Wallace St
- 54 Bernard St
- 94 Wilton St
- 78 Massreco St
- 98 Rollins St
- 73 Catalpa Terrace
- 110 Lamplighter Ln Unit C