
Landlord's Agent in 2022
Flora Chen Babij
Keller Williams Realty
(617) 888-2832
48 Total Sales


Estimated Value: $832,764 - $900,000
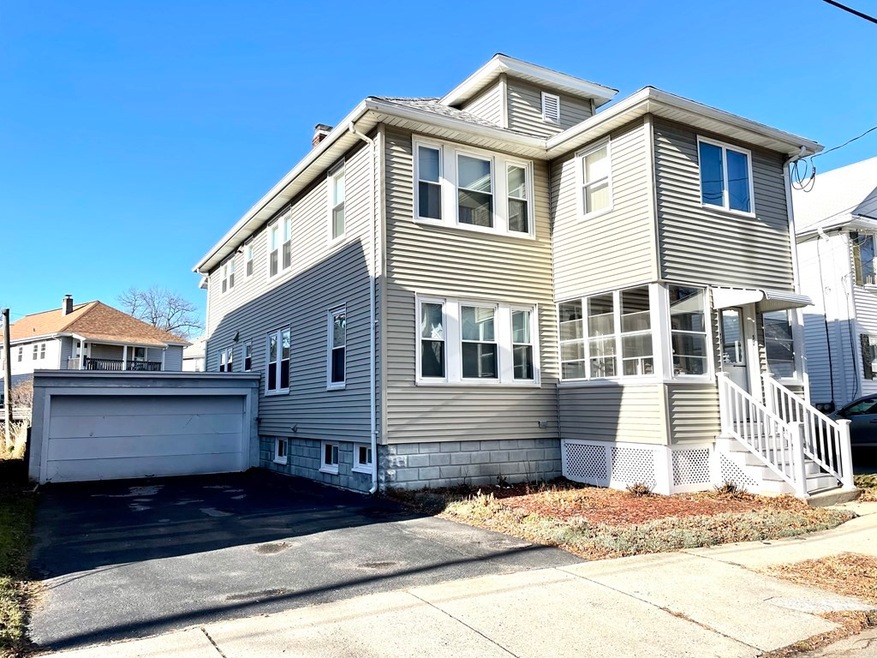
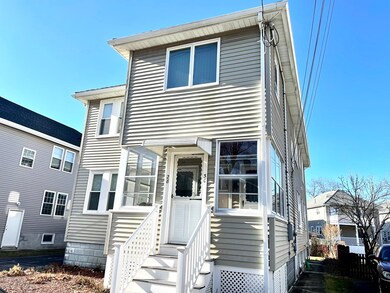
Fabulous first floor unit available now! This unit has nice layout of mudroom, living room, dinner room, eat-in kitchen and two good size bedrooms. Beautiful hardwood floors through out, new appliances including dishwasher, in unit washer & dryer. Gas heating and cooking. Great location, just minutes from shopping, groceries, schools, and highway access. Don't miss out!
| Date | Buyer | Sale Price | Title Company |
|---|---|---|---|
| Wong Yin S | $335,000 | -- | |
| Wong Yin S | $335,000 | -- | |
| Grant Ft | -- | -- |
| Date | Status | Borrower | Loan Amount |
|---|---|---|---|
| Open | Wong Yin S | $256,000 | |
| Closed | Wong Yin S | $256,000 |
| Date | Event | Price | List to Sale | Price per Sq Ft | Prior Sale |
|---|---|---|---|---|---|
| 01/28/2022 01/28/22 | Rented | -- | -- | -- | |
| 01/14/2022 01/14/22 | Under Contract | -- | -- | -- | |
| 12/22/2021 12/22/21 | For Rent | $2,100 | 0.0% | -- | |
| 04/30/2013 04/30/13 | Sold | $335,000 | +6.4% | $159 / Sq Ft | View Prior Sale |
| 03/31/2013 03/31/13 | Pending | -- | -- | -- | |
| 01/30/2013 01/30/13 | For Sale | $314,900 | -- | $149 / Sq Ft |
| Year | Tax Paid | Tax Assessment Tax Assessment Total Assessment is a certain percentage of the fair market value that is determined by local assessors to be the total taxable value of land and additions on the property. | Land | Improvement |
|---|---|---|---|---|
| 2025 | $86 | $762,700 | $296,200 | $466,500 |
| 2024 | $8,411 | $719,500 | $280,200 | $439,300 |
| 2023 | $7,944 | $651,700 | $256,200 | $395,500 |
| 2022 | $7,598 | $615,200 | $232,200 | $383,000 |
| 2021 | $7,315 | $595,200 | $212,200 | $383,000 |
| 2020 | $7,069 | $558,800 | $201,700 | $357,100 |
| 2019 | $6,752 | $508,800 | $192,100 | $316,700 |
| 2018 | $6,504 | $461,600 | $162,100 | $299,500 |
| 2017 | $6,249 | $441,000 | $162,100 | $278,900 |
| 2016 | $5,887 | $388,300 | $154,100 | $234,200 |
| 2015 | $5,699 | $362,300 | $145,300 | $217,000 |
| 2014 | $5,286 | $328,300 | $132,100 | $196,200 |
Landlord's Agent in 2022
Flora Chen Babij
Keller Williams Realty
(617) 888-2832
48 Total Sales
A
Tenant's Agent in 2022
Anne Genovese
Legacy Realty Advisors LLC
7 Total Sales
M
Seller's Agent in 2013
Marie Andrews
Pegasus Realty LLC
(781) 858-3505
35 Total Sales
Buyer's Agent in 2013
Ken Huang
Central Real Estate
(617) 828-1869
24 Total Sales
Source: MLS Property Information Network (MLS PIN)
MLS Number: 72929217
APN: MALD-000144-000676-000635
Disclaimer: Certain information contained herein is derived from information provided by parties other than Homes.com. All information provided is deemed reliable, but is not guaranteed to be accurate and should be independently verified.
![]() The property listing data and information, or the Images, set forth herein were provided to MLS Property Information Network, Inc. from third party sources, including sellers, lessors and public records, and were compiled by MLS Property Information Network, Inc. The property listing data and information, and the Images, are for the personal, non-commercial use of consumers having a good faith interest in purchasing or leasing listed properties of the type displayed to them and may not be used for any purpose other than to identify prospective properties which such consumers may have a good faith interest in purchasing or leasing. MLS Property Information Network, Inc. and its subscribers disclaim any and all representations and warranties as to the accuracy of the property listing data and information, or as to the accuracy of any of the Images, set forth herein.
The property listing data and information, or the Images, set forth herein were provided to MLS Property Information Network, Inc. from third party sources, including sellers, lessors and public records, and were compiled by MLS Property Information Network, Inc. The property listing data and information, and the Images, are for the personal, non-commercial use of consumers having a good faith interest in purchasing or leasing listed properties of the type displayed to them and may not be used for any purpose other than to identify prospective properties which such consumers may have a good faith interest in purchasing or leasing. MLS Property Information Network, Inc. and its subscribers disclaim any and all representations and warranties as to the accuracy of the property listing data and information, or as to the accuracy of any of the Images, set forth herein.
Ask me questions while you tour the home.