


28 Forest St Rockport, MA 01966
4
Beds
2
Baths
1,735
Sq Ft
2,178
Sq Ft Lot
Highlights
- Wood Flooring
- Garden
- Stone Wall
About This Home
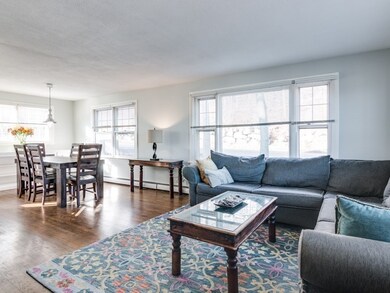
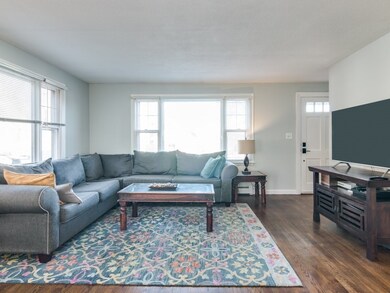
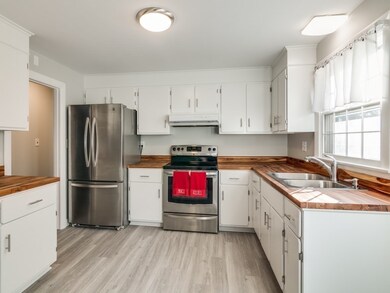
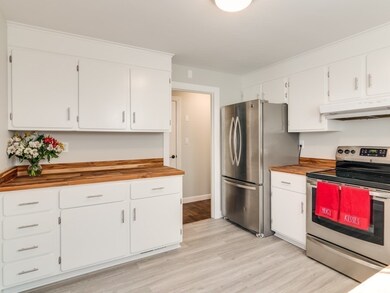
As of February 2021Moments from Sandy Bay and scenic Back and Front Beaches and a short stroll to delightful Millbrook Meadow and Rockport village, this classic 1,735 sf Cape is the perfect landing spot for anyone seeking a second home or a year-round residence. The home is deceptively spacious inside and has been thoughtfully renovated and redesigned and meticulously maintained. First floor highlights include light filled kitchen with new paint, flooring, counter-tops, a living room with adjoining dining area, and 3 bedrooms with hardwood floors and newly renovated full bathroom. The lower level invites entertaining and gathering with family and friends, with family room, home bar with seating for four, and a fourth bedroom for visitors, laundry and full bath. Newer systems including propane heat and hot water and attached one garage with ample storage and workspace complete this property—your gateway to the best life has to offer. Offers due today January 19th by 11:30 a.m.
Last Buyer's Agent
Kristine McManus
Keller Williams Realty Evolution
Home Details
Home Type
- Single Family
Est. Annual Taxes
- $5,120
Year Built
- Built in 1968
Lot Details
- Year Round Access
- Stone Wall
- Garden
- Property is zoned R3
Parking
- 1 Car Garage
Kitchen
- Range
- Disposal
Flooring
- Wood
- Tile
- Vinyl
Laundry
- Dryer
- Washer
Schools
- RHS High School
Utilities
- Hot Water Baseboard Heater
- Heating System Uses Propane
- Propane Water Heater
- Cable TV Available
Additional Features
- Basement
Ownership History
Date
Name
Owned For
Owner Type
Purchase Details
Listed on
Aug 15, 2014
Closed on
Aug 13, 2015
Sold by
Currier Ann L
Bought by
Currier Ft and Morris
Seller's Agent
Filippo Mastrocola
Welcome Home Properties, Inc.
Buyer's Agent
Holly Chiancola
Holly C & Co. Fine Homes
List Price
$399,900
Sold Price
$310,000
Premium/Discount to List
-$89,900
-22.48%
Current Estimated Value
Home Financials for this Owner
Home Financials are based on the most recent Mortgage that was taken out on this home.
Estimated Appreciation
$407,959
Avg. Annual Appreciation
8.75%
Original Mortgage
$294,500
Interest Rate
4.08%
Mortgage Type
New Conventional
Purchase Details
Closed on
Aug 29, 1997
Sold by
Dann Gregory G and Dann Allison J
Bought by
Currier Ann L
Purchase Details
Closed on
Jan 31, 1994
Sold by
Tupper S Regina Est and Tupper
Bought by
Dann Gregory G and Dann Allison
Home Financials for this Owner
Home Financials are based on the most recent Mortgage that was taken out on this home.
Original Mortgage
$133,000
Interest Rate
7.11%
Mortgage Type
Purchase Money Mortgage
Similar Home in Rockport, MA
Create a Home Valuation Report for This Property
The Home Valuation Report is an in-depth analysis detailing your home's value as well as a comparison with similar homes in the area
Home Values in the Area
Average Home Value in this Area
Purchase History
| Date | Type | Sale Price | Title Company |
|---|---|---|---|
| Quit Claim Deed | -- | -- | |
| Quit Claim Deed | -- | -- | |
| Deed | $155,000 | -- | |
| Deed | $155,000 | -- | |
| Deed | $140,000 | -- | |
| Deed | $140,000 | -- |
Source: Public Records
Mortgage History
| Date | Status | Loan Amount | Loan Type |
|---|---|---|---|
| Open | $375,224 | Stand Alone Refi Refinance Of Original Loan | |
| Closed | $432,000 | Purchase Money Mortgage | |
| Closed | $310,000 | Stand Alone Refi Refinance Of Original Loan | |
| Closed | $294,500 | New Conventional | |
| Previous Owner | $133,000 | Purchase Money Mortgage |
Source: Public Records
Property History
| Date | Event | Price | Change | Sq Ft Price |
|---|---|---|---|---|
| 02/19/2021 02/19/21 | Sold | $540,000 | +2.1% | $311 / Sq Ft |
| 01/20/2021 01/20/21 | Pending | -- | -- | -- |
| 01/16/2021 01/16/21 | For Sale | $529,000 | +70.6% | $305 / Sq Ft |
| 08/18/2015 08/18/15 | Sold | $310,000 | 0.0% | $284 / Sq Ft |
| 07/01/2015 07/01/15 | Off Market | $310,000 | -- | -- |
| 06/10/2015 06/10/15 | Price Changed | $339,800 | -2.9% | $311 / Sq Ft |
| 05/04/2015 05/04/15 | Price Changed | $349,800 | -4.1% | $320 / Sq Ft |
| 10/04/2014 10/04/14 | Price Changed | $364,800 | -1.1% | $334 / Sq Ft |
| 09/17/2014 09/17/14 | Price Changed | $369,000 | -2.6% | $338 / Sq Ft |
| 09/03/2014 09/03/14 | Price Changed | $379,000 | -2.6% | $347 / Sq Ft |
| 08/28/2014 08/28/14 | Price Changed | $389,000 | -2.7% | $356 / Sq Ft |
| 08/15/2014 08/15/14 | For Sale | $399,900 | -- | $366 / Sq Ft |
Source: MLS Property Information Network (MLS PIN)
Tax History Compared to Growth
Tax History
| Year | Tax Paid | Tax Assessment Tax Assessment Total Assessment is a certain percentage of the fair market value that is determined by local assessors to be the total taxable value of land and additions on the property. | Land | Improvement |
|---|---|---|---|---|
| 2025 | $5,120 | $584,500 | $324,200 | $260,300 |
| 2024 | $4,796 | $569,600 | $309,300 | $260,300 |
| 2023 | $4,838 | $513,000 | $286,000 | $227,000 |
| 2022 | $5,337 | $543,500 | $278,100 | $265,400 |
| 2021 | $5,039 | $517,400 | $264,800 | $252,600 |
| 2020 | $4,164 | $412,300 | $223,100 | $189,200 |
| 2019 | $3,911 | $396,700 | $218,100 | $178,600 |
| 2018 | $3,620 | $358,100 | $208,700 | $149,400 |
| 2017 | $3,532 | $313,100 | $189,300 | $123,800 |
| 2016 | $3,462 | $307,700 | $183,900 | $123,800 |
| 2015 | $3,373 | $306,600 | $183,900 | $122,700 |
| 2014 | $3,220 | $285,700 | $169,600 | $116,100 |
Source: Public Records
Agents Affiliated with this Home
-
Amanda Armstrong
Seller's Agent in 2021
Amanda Armstrong
Compass
(978) 879-6322
67 in this area
227 Total Sales
-
K
Buyer's Agent in 2021
Kristine McManus
Keller Williams Realty Evolution
-
F
Seller's Agent in 2015
Filippo Mastrocola
Welcome Home Properties, Inc.
-
Holly Chiancola
Buyer's Agent in 2015
Holly Chiancola
Holly C & Co. Fine Homes
(978) 281-4995
23 in this area
53 Total Sales
Map
Source: MLS Property Information Network (MLS PIN)
MLS Number: 72775657
APN: ROCK-000018-000000-000204A
Disclaimer: Certain information contained herein is derived from information provided by parties other than Homes.com. All information provided is deemed reliable, but is not guaranteed to be accurate and should be independently verified.
![]() The property listing data and information, or the Images, set forth herein were provided to MLS Property Information Network, Inc. from third party sources, including sellers, lessors and public records, and were compiled by MLS Property Information Network, Inc. The property listing data and information, and the Images, are for the personal, non-commercial use of consumers having a good faith interest in purchasing or leasing listed properties of the type displayed to them and may not be used for any purpose other than to identify prospective properties which such consumers may have a good faith interest in purchasing or leasing. MLS Property Information Network, Inc. and its subscribers disclaim any and all representations and warranties as to the accuracy of the property listing data and information, or as to the accuracy of any of the Images, set forth herein.
The property listing data and information, or the Images, set forth herein were provided to MLS Property Information Network, Inc. from third party sources, including sellers, lessors and public records, and were compiled by MLS Property Information Network, Inc. The property listing data and information, and the Images, are for the personal, non-commercial use of consumers having a good faith interest in purchasing or leasing listed properties of the type displayed to them and may not be used for any purpose other than to identify prospective properties which such consumers may have a good faith interest in purchasing or leasing. MLS Property Information Network, Inc. and its subscribers disclaim any and all representations and warranties as to the accuracy of the property listing data and information, or as to the accuracy of any of the Images, set forth herein.
Nearby Homes
- 1 Doctors Run
- 123 Main St Unit 2
- 27 Quarry Ridge Ln
- 73-77 Main St
- 0 Squam Rd
- 135 A&B Main St
- 36 Broadway Ave
- 2 Boulder Top
- 24 School St
- 5 Parker St
- 14 Paradis Cir Unit 2
- 1 Dock Square
- 2 Wharf Rd
- 2 Mount Pleasant St Unit 3
- 10 Mt Pleasant Unit C
- 10 Mt Pleasant Unit B
- 76 Granite St
- 5 Allen Ave
- 9 Landmark Ln
- 29 Summer St