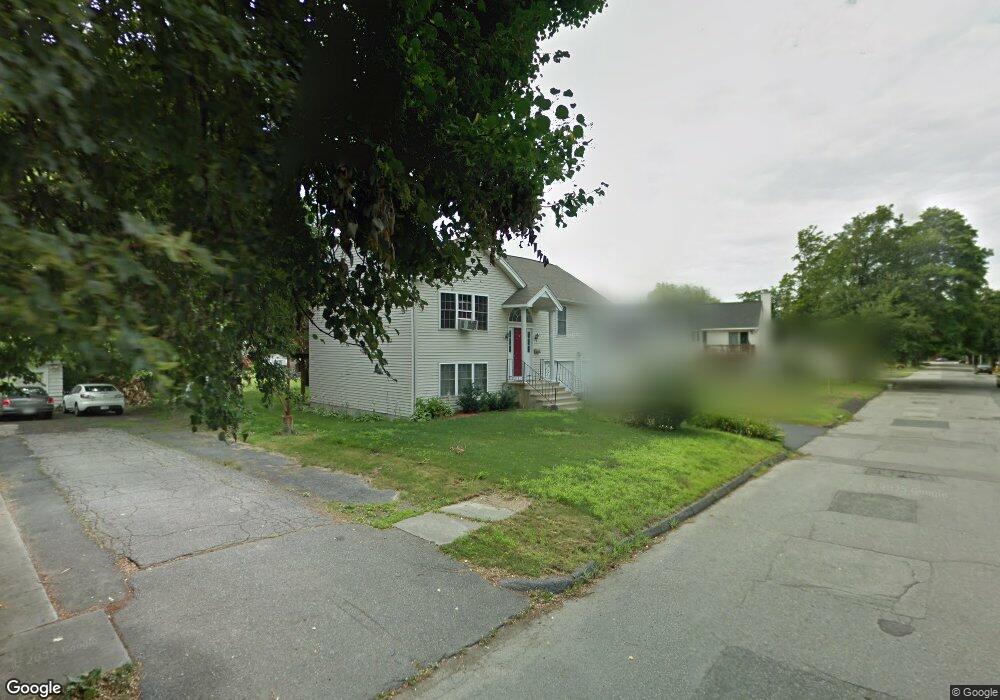
28 Frothingham Rd Worcester, MA 01605
Brittan Square NeighborhoodEstimated Value: $513,547 - $589,000
6
Beds
3
Baths
2,488
Sq Ft
$219/Sq Ft
Est. Value
About This Home
This home is located at 28 Frothingham Rd, Worcester, MA 01605 and is currently estimated at $545,137, approximately $219 per square foot. 28 Frothingham Rd is a home located in Worcester County with nearby schools including Jacob Hiatt Magnet School, Chandler Magnet, and Wawecus Road School.
Ownership History
Date
Name
Owned For
Owner Type
Purchase Details
Closed on
Jun 14, 2010
Sold by
Mccarthy Peter
Bought by
Raptis Philip G
Current Estimated Value
Purchase Details
Closed on
Sep 15, 2004
Sold by
Fontaine Daniel H and Grossman Joshua J
Bought by
Mccarthy Peter
Home Financials for this Owner
Home Financials are based on the most recent Mortgage that was taken out on this home.
Original Mortgage
$242,400
Interest Rate
6.02%
Mortgage Type
Purchase Money Mortgage
Purchase Details
Closed on
Jul 3, 2001
Sold by
Burden Bruce F and Paula Burden M
Bought by
Fontaine Daniel H and Grossman Joshua J
Home Financials for this Owner
Home Financials are based on the most recent Mortgage that was taken out on this home.
Original Mortgage
$242,838
Interest Rate
7.14%
Mortgage Type
Purchase Money Mortgage
Create a Home Valuation Report for This Property
The Home Valuation Report is an in-depth analysis detailing your home's value as well as a comparison with similar homes in the area
Home Values in the Area
Average Home Value in this Area
Purchase History
| Date | Buyer | Sale Price | Title Company |
|---|---|---|---|
| Raptis Philip G | $125,000 | -- | |
| Mccarthy Peter | -- | -- | |
| Fontaine Daniel H | $245,000 | -- |
Source: Public Records
Mortgage History
| Date | Status | Borrower | Loan Amount |
|---|---|---|---|
| Previous Owner | Fontaine Daniel H | $15,000 | |
| Previous Owner | Mccarthy Peter | $242,400 | |
| Previous Owner | Mccarthy Peter | $60,600 | |
| Previous Owner | Fontaine Daniel H | $242,838 |
Source: Public Records
Tax History
| Year | Tax Paid | Tax Assessment Tax Assessment Total Assessment is a certain percentage of the fair market value that is determined by local assessors to be the total taxable value of land and additions on the property. | Land | Improvement |
|---|---|---|---|---|
| 2025 | $6,240 | $473,100 | $118,800 | $354,300 |
| 2024 | $6,104 | $443,900 | $118,800 | $325,100 |
| 2023 | $5,881 | $410,100 | $103,300 | $306,800 |
| 2022 | $5,451 | $358,400 | $82,700 | $275,700 |
| 2021 | $5,415 | $332,600 | $66,200 | $266,400 |
| 2020 | $5,239 | $308,200 | $66,100 | $242,100 |
| 2019 | $5,247 | $291,500 | $59,600 | $231,900 |
| 2018 | $5,191 | $274,500 | $59,600 | $214,900 |
| 2017 | $5,011 | $260,700 | $59,600 | $201,100 |
| 2016 | $5,041 | $244,600 | $44,000 | $200,600 |
| 2015 | $4,909 | $244,600 | $44,000 | $200,600 |
| 2014 | $4,779 | $244,600 | $44,000 | $200,600 |
Source: Public Records
Map
Nearby Homes
Your Personal Tour Guide
Ask me questions while you tour the home.