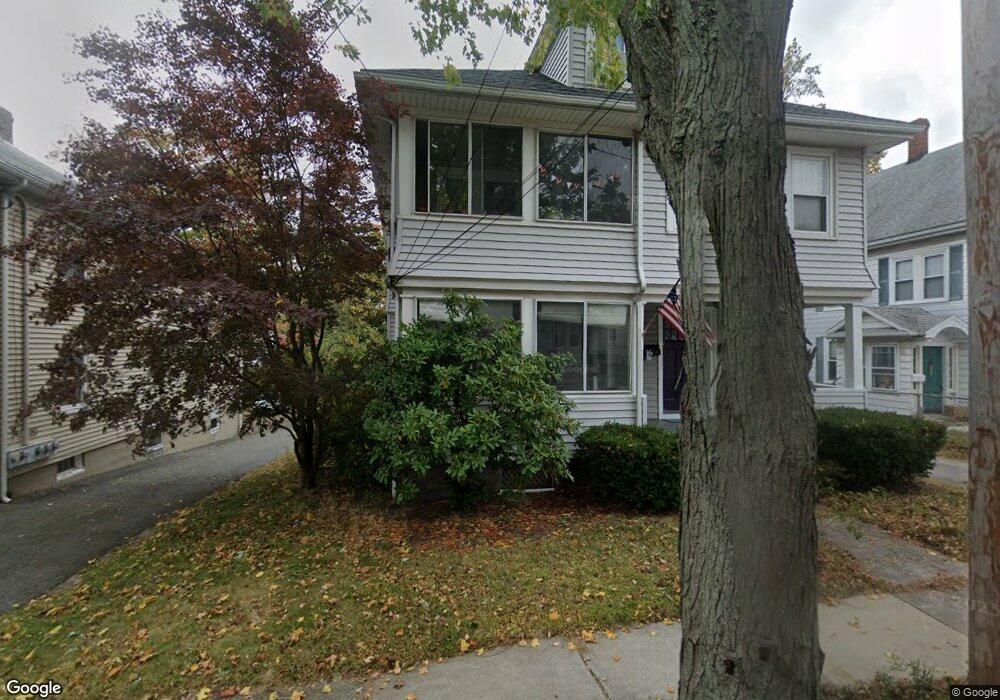
28 Gilmore St Quincy, MA 02170
Quincy Center NeighborhoodEstimated Value: $797,000 - $1,008,000
5
Beds
2
Baths
2,282
Sq Ft
$405/Sq Ft
Est. Value
About This Home
This home is located at 28 Gilmore St, Quincy, MA 02170 and is currently estimated at $924,963, approximately $405 per square foot. 28 Gilmore St is a home located in Norfolk County with nearby schools including Merrymount Elementary School, Central Middle School, and North Quincy High School.
Ownership History
Date
Name
Owned For
Owner Type
Purchase Details
Closed on
Apr 15, 2009
Sold by
Mcmahon Richard A
Bought by
Beqaj Ismail M and Hajrizaj Teuta
Current Estimated Value
Home Financials for this Owner
Home Financials are based on the most recent Mortgage that was taken out on this home.
Original Mortgage
$338,318
Outstanding Balance
$214,788
Interest Rate
5.02%
Mortgage Type
Purchase Money Mortgage
Estimated Equity
$710,175
Create a Home Valuation Report for This Property
The Home Valuation Report is an in-depth analysis detailing your home's value as well as a comparison with similar homes in the area
Home Values in the Area
Average Home Value in this Area
Purchase History
| Date | Buyer | Sale Price | Title Company |
|---|---|---|---|
| Beqaj Ismail M | $345,000 | -- |
Source: Public Records
Mortgage History
| Date | Status | Borrower | Loan Amount |
|---|---|---|---|
| Open | Beqaj Ismail M | $338,318 |
Source: Public Records
Tax History Compared to Growth
Tax History
| Year | Tax Paid | Tax Assessment Tax Assessment Total Assessment is a certain percentage of the fair market value that is determined by local assessors to be the total taxable value of land and additions on the property. | Land | Improvement |
|---|---|---|---|---|
| 2025 | $9,924 | $860,700 | $358,700 | $502,000 |
| 2024 | $9,528 | $845,400 | $358,700 | $486,700 |
| 2023 | $9,050 | $813,100 | $341,600 | $471,500 |
| 2022 | $8,632 | $720,500 | $273,300 | $447,200 |
| 2021 | $8,783 | $723,500 | $273,300 | $450,200 |
| 2020 | $8,723 | $701,800 | $273,300 | $428,500 |
| 2019 | $8,279 | $659,700 | $255,400 | $404,300 |
| 2018 | $7,719 | $578,600 | $232,200 | $346,400 |
| 2017 | $7,935 | $560,000 | $232,200 | $327,800 |
| 2016 | $7,074 | $492,600 | $211,000 | $281,600 |
| 2015 | $6,698 | $458,800 | $191,900 | $266,900 |
| 2014 | $5,838 | $392,900 | $182,700 | $210,200 |
Source: Public Records
Map
Nearby Homes
- 45 Oval Rd Unit 6
- 72 Oakland Ave
- 1025 Hancock St Unit 2K
- 10 Presidents Ln Unit 10
- 20 Putnam St
- 74 Butler Rd
- 200 Adams St
- 77 Adams St Unit 610
- 22 Newton Ave
- 465 Newport Ave
- 163 Clay St Unit C
- 1 Adams St Unit 707
- 111 Warren Ave Unit 1F
- 100 Grandview Ave Unit 11A
- 20 Whitney Rd Unit 1
- 89 Puritan Dr
- 25 Carrolls Ln
- 100 Thornton St
- 140 Phillips St
- 1427 Quincy Shore Dr
- 28 Gilmore St Unit 1
- 28 Gilmore St Unit 2
- 30 Gilmore St Unit 30
- 24 Gilmore St Unit 1
- 24 Gilmore St Unit 2
- 24 Gilmore St Unit 4
- 32 Gilmore St
- 20 Gilmore St
- 29 Gilmore St Unit SF
- 29 Gilmore St
- 29 Gilmore St Unit 29
- 25 Gilmore St
- 31 Gilmore St
- 21 Gilmore St
- 23 Carruth St
- 16 Gilmore St
- 35 Gilmore St
- 18 Gilmore St
- 19 Gilmore St
- 42 Gilmore St