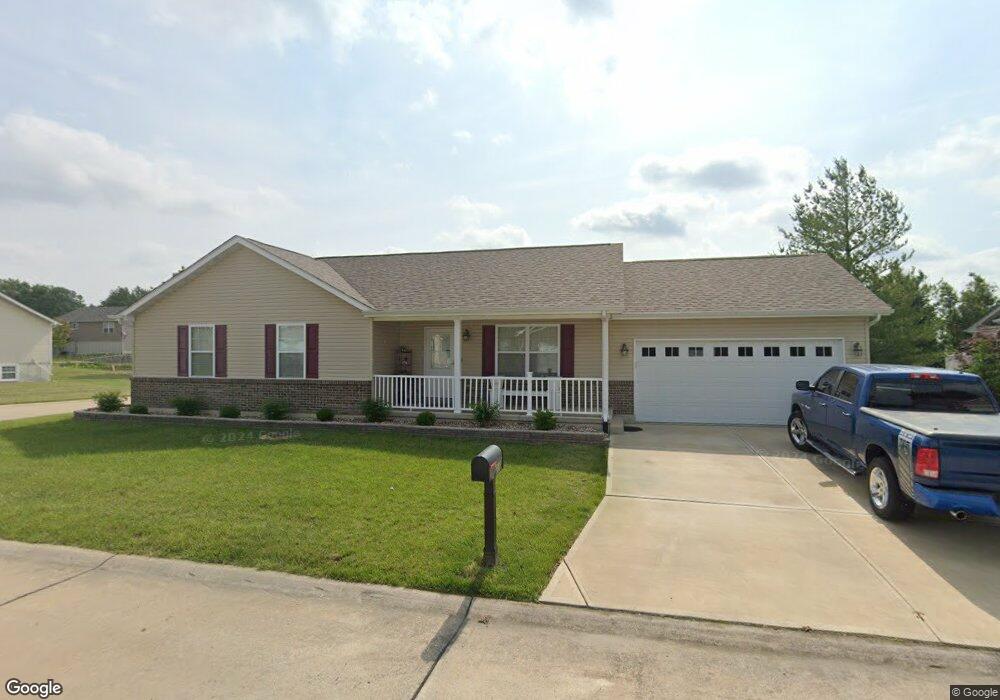
28 Grayhawk Dr Winfield, MO 63389
Estimated Value: $274,941 - $294,000
3
Beds
2
Baths
1,260
Sq Ft
$225/Sq Ft
Est. Value
About This Home
This home is located at 28 Grayhawk Dr, Winfield, MO 63389 and is currently estimated at $282,985, approximately $224 per square foot. 28 Grayhawk Dr is a home located in Lincoln County with nearby schools including Cuivre Park Elementary School, Troy Middle School, and Troy Buchanan High School.
Ownership History
Date
Name
Owned For
Owner Type
Purchase Details
Closed on
Nov 16, 2018
Sold by
Moore Douglas E and Moore Judy Kay
Bought by
Bright David and Bright Robin
Current Estimated Value
Home Financials for this Owner
Home Financials are based on the most recent Mortgage that was taken out on this home.
Original Mortgage
$136,000
Outstanding Balance
$119,826
Interest Rate
4.9%
Mortgage Type
New Conventional
Estimated Equity
$163,159
Purchase Details
Closed on
May 13, 2010
Sold by
Huff Moore Julia Ann
Bought by
Moore Douglas E
Purchase Details
Closed on
Mar 25, 2005
Sold by
East Missouri Development Llc
Bought by
Moore Douglas E and Moore Julia A
Home Financials for this Owner
Home Financials are based on the most recent Mortgage that was taken out on this home.
Original Mortgage
$139,500
Interest Rate
5.67%
Mortgage Type
Construction
Create a Home Valuation Report for This Property
The Home Valuation Report is an in-depth analysis detailing your home's value as well as a comparison with similar homes in the area
Purchase History
| Date | Buyer | Sale Price | Title Company |
|---|---|---|---|
| Bright David | -- | Select Title Group | |
| Moore Douglas E | -- | None Available | |
| Moore Douglas E | -- | Meyer Title Company |
Source: Public Records
Mortgage History
| Date | Status | Borrower | Loan Amount |
|---|---|---|---|
| Open | Bright David | $136,000 | |
| Previous Owner | Moore Douglas E | $139,500 |
Source: Public Records
Tax History
| Year | Tax Paid | Tax Assessment Tax Assessment Total Assessment is a certain percentage of the fair market value that is determined by local assessors to be the total taxable value of land and additions on the property. | Land | Improvement |
|---|---|---|---|---|
| 2025 | $2,328 | $38,088 | $5,917 | $32,171 |
| 2024 | $2,198 | $35,275 | $5,202 | $30,073 |
| 2023 | $2,186 | $35,275 | $5,202 | $30,073 |
| 2022 | $2,071 | $33,250 | $5,202 | $28,048 |
| 2021 | $2,082 | $175,000 | $0 | $0 |
| 2020 | $1,794 | $150,760 | $0 | $0 |
| 2019 | $1,792 | $150,380 | $0 | $0 |
| 2018 | $241 | $3,800 | $0 | $0 |
| 2017 | $242 | $3,800 | $0 | $0 |
| 2016 | $248 | $3,800 | $0 | $0 |
| 2015 | $249 | $3,800 | $0 | $0 |
| 2014 | $249 | $3,800 | $0 | $0 |
| 2013 | -- | $3,800 | $0 | $0 |
Source: Public Records
Map
Nearby Homes
- 215 Hunters Chase St
- 0 Hwy 47 & Hwy W - Lot 3 (2 6+ - Acres)
- 0 Hwy 47 & Hwy W - Lot 7 (2 2+ - Acres)
- 0 Hwy 47 & Hwy W - Lot 2 (2 3+ - Acres)
- 0
- 54 Silver Spur Dr
- 0 Hwy 47 & Hwy W - Lot 6 (16 5+ - Acres)
- 153 Equestrian Dr
- 22 Saddleback Ridge Dr
- 38 Saddleback Ridge Dr
- 435 Winchester Way
- 70 Round Table Ct
- 216 Red Mare Rd
- 77 Colton Jesse Dr
- 151 Hidden Valley Way
- 3218 S Highway - Lot 4
- 3218 S Highway - Lot 3
- 3218 S Highway W - Lot 7
- 3218 S Highway - Lot 1
- 3218 S Highway - Lot 2
- 230 Hunters Chase St
- 220 Hunters Chase St
- 101 Granite Pointe Ln
- 250 Hunters Chase St
- 111 Granite Pointe Ln
- 235 Hunters Chase St
- 210 Hunters Chase St
- 225 Hunters Chase St
- 1 Overlook Place
- 121 Granite Pointe Ln
- 255 Hunters Chase St
- 260 Hunters Chase St
- 3 Overlook Place
- 265 Hunters Chase St
- 200 Hunters Chase St
- 20 Grayhawk Dr
- 130 Granite Pointe Ln
- 131 Granite Pointe Ln
- 270 Hunters Chase St
- 205 Hunters Chase St
Your Personal Tour Guide
Ask me questions while you tour the home.