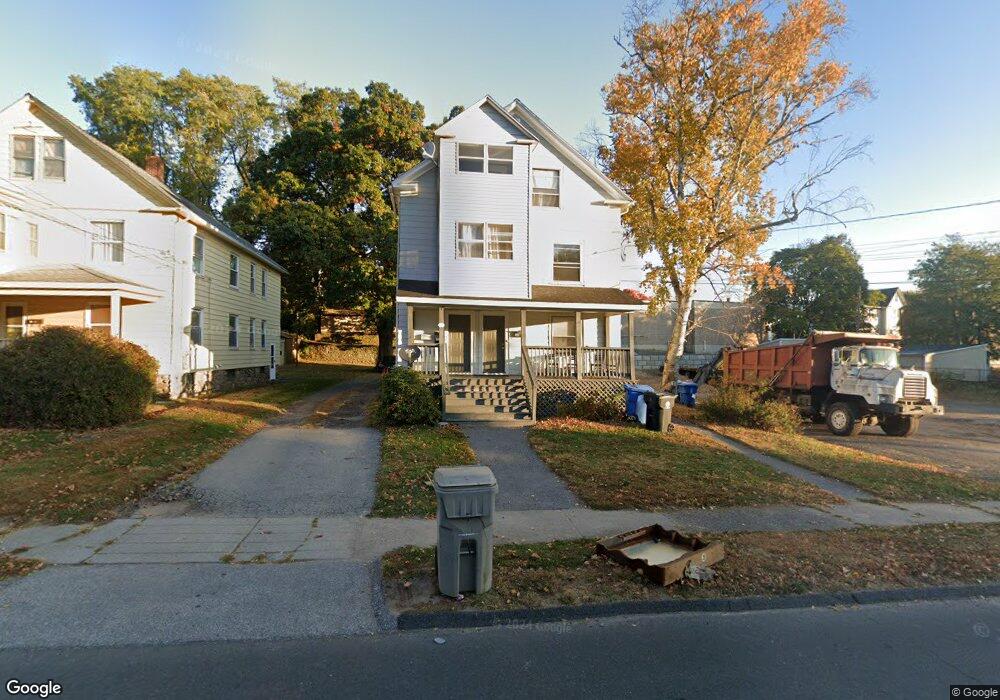
28 Gridley St Bristol, CT 06010
West End/Bristol NeighborhoodEstimated Value: $357,558 - $469,000
6
Beds
3
Baths
3,058
Sq Ft
$136/Sq Ft
Est. Value
About This Home
This home is located at 28 Gridley St, Bristol, CT 06010 and is currently estimated at $416,640, approximately $136 per square foot. 28 Gridley St is a home located in Hartford County with nearby schools including Chippens Hill Middle School, Bristol Central High School, and Immanuel Lutheran School.
Ownership History
Date
Name
Owned For
Owner Type
Purchase Details
Closed on
Jan 10, 2023
Sold by
Connecticut Housing Finan
Bought by
Girardin Nora T
Current Estimated Value
Purchase Details
Closed on
May 19, 2008
Sold by
Ferranti 3Rd Albert A
Bought by
Hernandez Filogonio
Home Financials for this Owner
Home Financials are based on the most recent Mortgage that was taken out on this home.
Original Mortgage
$211,678
Interest Rate
5.91%
Purchase Details
Closed on
Oct 10, 2001
Sold by
Hamlin Michael C
Bought by
Ferranti Albert A
Home Financials for this Owner
Home Financials are based on the most recent Mortgage that was taken out on this home.
Original Mortgage
$121,500
Interest Rate
6.93%
Purchase Details
Closed on
Jun 20, 2001
Sold by
Coulombe Joseph C
Bought by
Hamlin Michael C
Create a Home Valuation Report for This Property
The Home Valuation Report is an in-depth analysis detailing your home's value as well as a comparison with similar homes in the area
Home Values in the Area
Average Home Value in this Area
Purchase History
| Date | Buyer | Sale Price | Title Company |
|---|---|---|---|
| Girardin Nora T | $190,000 | None Available | |
| Hernandez Filogonio | $215,000 | -- | |
| Ferranti Albert A | $135,000 | -- | |
| Hamlin Michael C | $110,000 | -- |
Source: Public Records
Mortgage History
| Date | Status | Borrower | Loan Amount |
|---|---|---|---|
| Previous Owner | Hamlin Michael C | $211,678 | |
| Previous Owner | Hamlin Michael C | $136,500 | |
| Previous Owner | Hamlin Michael C | $125,300 | |
| Previous Owner | Hamlin Michael C | $121,500 |
Source: Public Records
Tax History
| Year | Tax Paid | Tax Assessment Tax Assessment Total Assessment is a certain percentage of the fair market value that is determined by local assessors to be the total taxable value of land and additions on the property. | Land | Improvement |
|---|---|---|---|---|
| 2025 | $6,773 | $200,690 | $28,140 | $172,550 |
| 2024 | $6,392 | $200,690 | $28,140 | $172,550 |
| 2023 | $6,091 | $200,690 | $28,140 | $172,550 |
| 2022 | $4,741 | $123,620 | $16,030 | $107,590 |
| 2021 | $4,741 | $123,620 | $16,030 | $107,590 |
| 2020 | $4,741 | $123,620 | $16,030 | $107,590 |
| 2019 | $4,704 | $123,620 | $16,030 | $107,590 |
| 2018 | $4,559 | $123,620 | $16,030 | $107,590 |
| 2017 | $4,396 | $122,010 | $30,520 | $91,490 |
| 2016 | $4,396 | $122,010 | $30,520 | $91,490 |
| 2015 | $4,223 | $122,010 | $30,520 | $91,490 |
| 2014 | $4,223 | $122,010 | $30,520 | $91,490 |
Source: Public Records
Map
Nearby Homes
- 28 Gridley St Unit 3 Bedrooms
- 26 Gridley St
- 36 Gridley St
- 27 Gridley St
- 23 Gridley St
- 23 Gridley St Unit First Floor
- 29 Gridley St
- 31 Gridley St
- 14 Gridley St
- 14 Gridley St Unit 1
- 38 Gridley St
- 38 Gridley St Unit 1
- 38 Gridley St Unit 42
- 44 Gridley St
- 42 Gridley St
- 13 Gridley St
- 19 Gridley St
- 41 Gridley St
- 41 West St
- 48 Gridley St
Your Personal Tour Guide
Ask me questions while you tour the home.