Estimated Value: $586,000 - $770,000
--
Bed
--
Bath
2,527
Sq Ft
$268/Sq Ft
Est. Value
About This Home
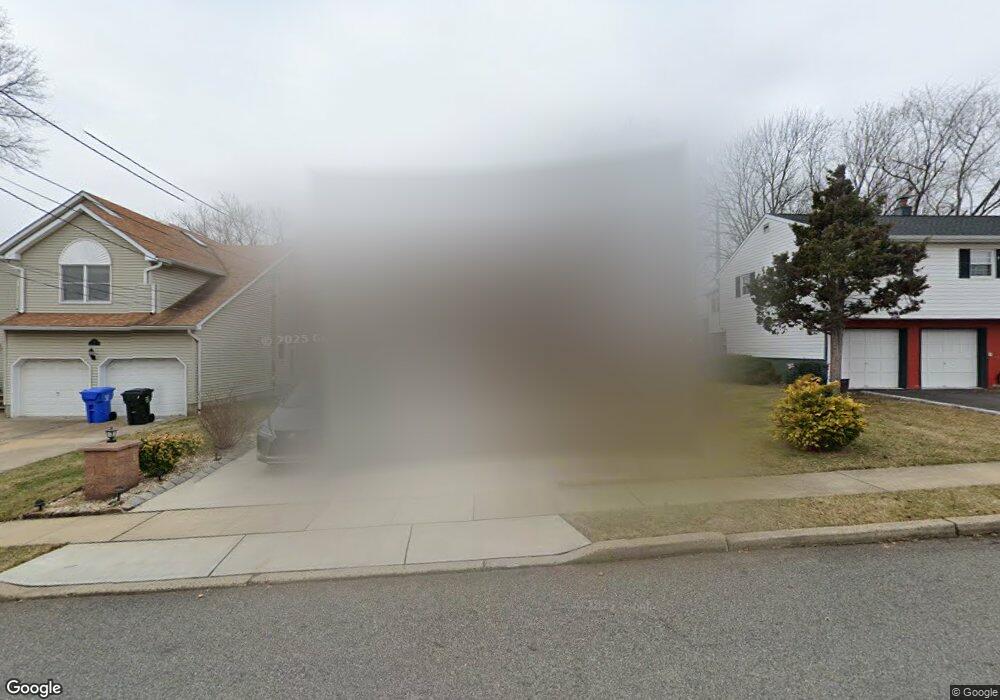
This home is located at 28 Grissom Place, Fords, NJ 08863 and is currently estimated at $676,656, approximately $267 per square foot. 28 Grissom Place is a home located in Middlesex County with nearby schools including Lafayette Estates School #25, Fords Middle School, and Woodbridge High School.
Ownership History
Date
Name
Owned For
Owner Type
Purchase Details
Closed on
Mar 4, 2025
Sold by
Lal Madan and Rani Asha
Bought by
Vaid Narinder Kumar and Vaid Reena
Current Estimated Value
Home Financials for this Owner
Home Financials are based on the most recent Mortgage that was taken out on this home.
Original Mortgage
$325,000
Outstanding Balance
$297,290
Interest Rate
6.89%
Mortgage Type
Seller Take Back
Estimated Equity
$379,366
Purchase Details
Closed on
Oct 8, 2004
Sold by
Samuel Wadie W
Bought by
Madan Lal
Home Financials for this Owner
Home Financials are based on the most recent Mortgage that was taken out on this home.
Original Mortgage
$333,000
Interest Rate
5.68%
Purchase Details
Closed on
Sep 30, 1997
Sold by
Dotro Raffaele
Bought by
Wadie Samuel and Samuel Magda
Home Financials for this Owner
Home Financials are based on the most recent Mortgage that was taken out on this home.
Original Mortgage
$180,000
Interest Rate
7.52%
Create a Home Valuation Report for This Property
The Home Valuation Report is an in-depth analysis detailing your home's value as well as a comparison with similar homes in the area
Home Values in the Area
Average Home Value in this Area
Purchase History
| Date | Buyer | Sale Price | Title Company |
|---|---|---|---|
| Vaid Narinder Kumar | $650,000 | Aglobal Title | |
| Vaid Narinder Kumar | $650,000 | Aglobal Title | |
| Madan Lal | $461,000 | -- | |
| Wadie Samuel | $243,000 | -- |
Source: Public Records
Mortgage History
| Date | Status | Borrower | Loan Amount |
|---|---|---|---|
| Open | Vaid Narinder Kumar | $325,000 | |
| Closed | Vaid Narinder Kumar | $325,000 | |
| Previous Owner | Madan Lal | $333,000 | |
| Previous Owner | Wadie Samuel | $180,000 |
Source: Public Records
Tax History Compared to Growth
Tax History
| Year | Tax Paid | Tax Assessment Tax Assessment Total Assessment is a certain percentage of the fair market value that is determined by local assessors to be the total taxable value of land and additions on the property. | Land | Improvement |
|---|---|---|---|---|
| 2025 | $15,784 | $125,000 | $25,200 | $99,800 |
| 2024 | $15,324 | $125,000 | $25,200 | $99,800 |
| 2023 | $15,324 | $125,000 | $25,200 | $99,800 |
| 2022 | $14,911 | $125,000 | $25,200 | $99,800 |
| 2021 | $14,758 | $125,000 | $25,200 | $99,800 |
| 2020 | $14,278 | $125,000 | $25,200 | $99,800 |
| 2019 | $13,910 | $125,000 | $25,200 | $99,800 |
| 2018 | $13,635 | $125,000 | $25,200 | $99,800 |
| 2017 | $13,395 | $125,000 | $25,200 | $99,800 |
| 2016 | $13,285 | $125,000 | $25,200 | $99,800 |
| 2015 | $13,026 | $125,000 | $25,200 | $99,800 |
| 2014 | $12,743 | $125,000 | $25,200 | $99,800 |
Source: Public Records
Map
Nearby Homes
- 128 Burnham Dr
- 4 Carr Place
- 30 Judson St Unit 8B
- 47 Judson St Unit 16B
- 47 Judson St Unit 9A
- 47 Judson St Unit 14B
- 32 Judson St Unit 10-A
- 59 Hearthstone Ave
- 57 Judson St Unit 4A
- 57 Judson St Unit 3 B
- 182 Evergreen Rd Unit 3B
- 199 Evergreen Rd Unit 14A
- 199 Evergreen Rd Unit 5B
- 197 Evergreen Rd Unit 3A
- 62 Harmon Rd
- 197 Evergreen 6a Rd
- 140 Ethel St
- 47 De Grasse St
- 149 Ethel St
- 29 Highland Terrace