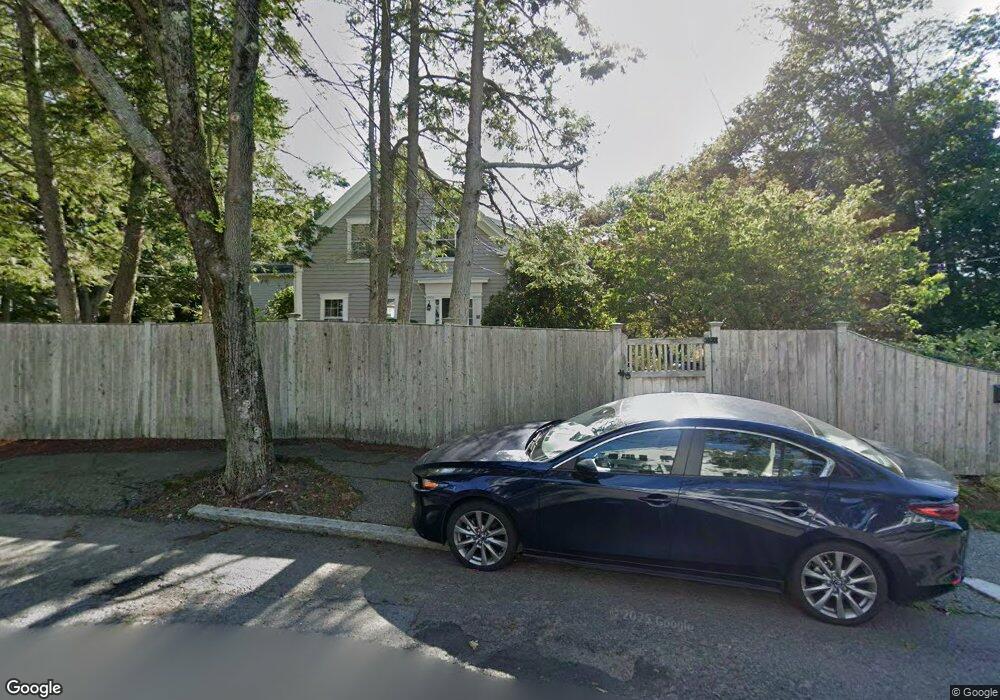
28 High St Unit 3 Beverly, MA 01915
Beverly Farms NeighborhoodEstimated Value: $815,000 - $1,121,000
3
Beds
3
Baths
2,485
Sq Ft
$374/Sq Ft
Est. Value
About This Home
This home is located at 28 High St Unit 3, Beverly, MA 01915 and is currently estimated at $928,674, approximately $373 per square foot. 28 High St Unit 3 is a home located in Essex County with nearby schools including Beverly High School, Glen Urquhart School, and Tara Montessori School.
Ownership History
Date
Name
Owned For
Owner Type
Purchase Details
Closed on
Feb 11, 2011
Sold by
Anderson Brian W
Bought by
Jack Elizabeth M
Current Estimated Value
Purchase Details
Closed on
Jan 12, 2007
Sold by
Maloney 3Rd James P and Maloney Rosaline M
Bought by
Anderson Brian W
Home Financials for this Owner
Home Financials are based on the most recent Mortgage that was taken out on this home.
Original Mortgage
$338,350
Interest Rate
6.18%
Mortgage Type
Purchase Money Mortgage
Purchase Details
Closed on
Jul 13, 2001
Sold by
Metternick Stacey L and Poucher Stacey L
Bought by
Maloney James P and Maloney Rosaline M
Purchase Details
Closed on
Sep 8, 1995
Sold by
Newman Charles J and Newman Suzanne
Bought by
Poucher Stacey L
Purchase Details
Closed on
Mar 16, 1989
Sold by
Boches Scott
Bought by
Boches Brian
Create a Home Valuation Report for This Property
The Home Valuation Report is an in-depth analysis detailing your home's value as well as a comparison with similar homes in the area
Home Values in the Area
Average Home Value in this Area
Purchase History
| Date | Buyer | Sale Price | Title Company |
|---|---|---|---|
| Jack Elizabeth M | -- | -- | |
| Jack Elizabeth M | -- | -- | |
| Anderson Brian W | $43,833,333 | -- | |
| Maloney James P | $393,000 | -- | |
| Poucher Stacey L | $183,000 | -- | |
| Boches Brian | $259,000 | -- |
Source: Public Records
Mortgage History
| Date | Status | Borrower | Loan Amount |
|---|---|---|---|
| Previous Owner | Boches Brian | $338,350 | |
| Previous Owner | Boches Brian | $319,000 | |
| Previous Owner | Boches Brian | $121,000 |
Source: Public Records
Tax History
| Year | Tax Paid | Tax Assessment Tax Assessment Total Assessment is a certain percentage of the fair market value that is determined by local assessors to be the total taxable value of land and additions on the property. | Land | Improvement |
|---|---|---|---|---|
| 2025 | $8,272 | $752,700 | $0 | $752,700 |
| 2024 | $7,817 | $696,100 | $0 | $696,100 |
| 2023 | $7,371 | $654,600 | $0 | $654,600 |
| 2022 | $7,587 | $623,400 | $0 | $623,400 |
| 2021 | $7,600 | $598,400 | $0 | $598,400 |
| 2020 | $7,159 | $558,000 | $0 | $558,000 |
| 2019 | $6,823 | $516,500 | $0 | $516,500 |
| 2018 | $5,980 | $439,700 | $0 | $439,700 |
| 2017 | $6,065 | $424,700 | $0 | $424,700 |
| 2016 | $6,009 | $417,600 | $0 | $417,600 |
| 2015 | $5,892 | $417,600 | $0 | $417,600 |
Source: Public Records
Map
Nearby Homes
Your Personal Tour Guide
Ask me questions while you tour the home.