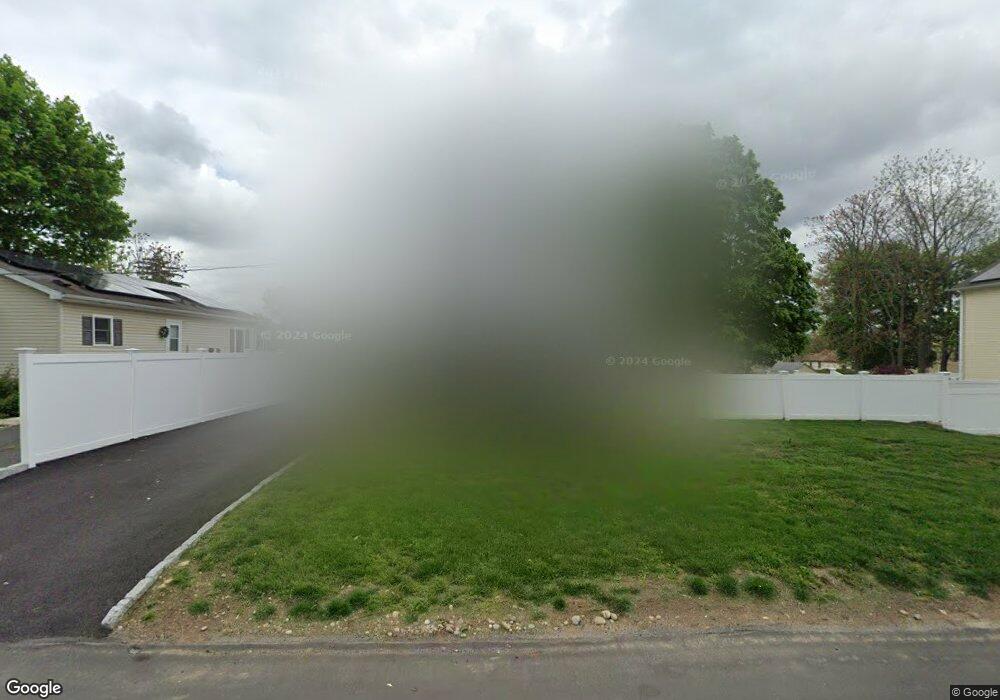
28 High St Garnerville, NY 10923
Estimated Value: $454,000 - $600,000
3
Beds
3
Baths
1,852
Sq Ft
$299/Sq Ft
Est. Value
About This Home
This home is located at 28 High St, Garnerville, NY 10923 and is currently estimated at $554,101, approximately $299 per square foot. 28 High St is a home located in Rockland County with nearby schools including Haverstraw Elementary School, West Haverstraw Elementary School, and Fieldstone Secondary School.
Ownership History
Date
Name
Owned For
Owner Type
Purchase Details
Closed on
Sep 30, 2010
Sold by
Nivar Juan and Nivar Valerie
Bought by
Vargas Gwendolyn and Vargas Algeniz J
Current Estimated Value
Home Financials for this Owner
Home Financials are based on the most recent Mortgage that was taken out on this home.
Original Mortgage
$294,828
Outstanding Balance
$194,555
Interest Rate
4.35%
Mortgage Type
New Conventional
Estimated Equity
$359,546
Purchase Details
Closed on
Jan 20, 2009
Sold by
Turlington Mary
Bought by
Nivar Juan and Nivar Valerie
Create a Home Valuation Report for This Property
The Home Valuation Report is an in-depth analysis detailing your home's value as well as a comparison with similar homes in the area
Home Values in the Area
Average Home Value in this Area
Purchase History
| Date | Buyer | Sale Price | Title Company |
|---|---|---|---|
| Vargas Gwendolyn | $266,900 | The Judicial Title Insurance | |
| Nivar Juan | $158,000 | None Available |
Source: Public Records
Mortgage History
| Date | Status | Borrower | Loan Amount |
|---|---|---|---|
| Open | Vargas Gwendolyn | $294,828 |
Source: Public Records
Tax History Compared to Growth
Tax History
| Year | Tax Paid | Tax Assessment Tax Assessment Total Assessment is a certain percentage of the fair market value that is determined by local assessors to be the total taxable value of land and additions on the property. | Land | Improvement |
|---|---|---|---|---|
| 2024 | $8,106 | $113,600 | $91,800 | $21,800 |
| 2023 | $8,106 | $113,600 | $91,800 | $21,800 |
| 2022 | $1,427 | $113,600 | $91,800 | $21,800 |
| 2021 | $7,997 | $113,600 | $91,800 | $21,800 |
| 2020 | $4,864 | $113,600 | $91,800 | $21,800 |
| 2019 | $1,222 | $113,600 | $91,800 | $21,800 |
| 2018 | $4,599 | $113,600 | $91,800 | $21,800 |
| 2017 | $4,285 | $113,600 | $91,800 | $21,800 |
| 2016 | $4,309 | $113,600 | $91,800 | $21,800 |
| 2015 | -- | $113,600 | $91,800 | $21,800 |
| 2014 | -- | $113,600 | $91,800 | $21,800 |
Source: Public Records
Map
Nearby Homes