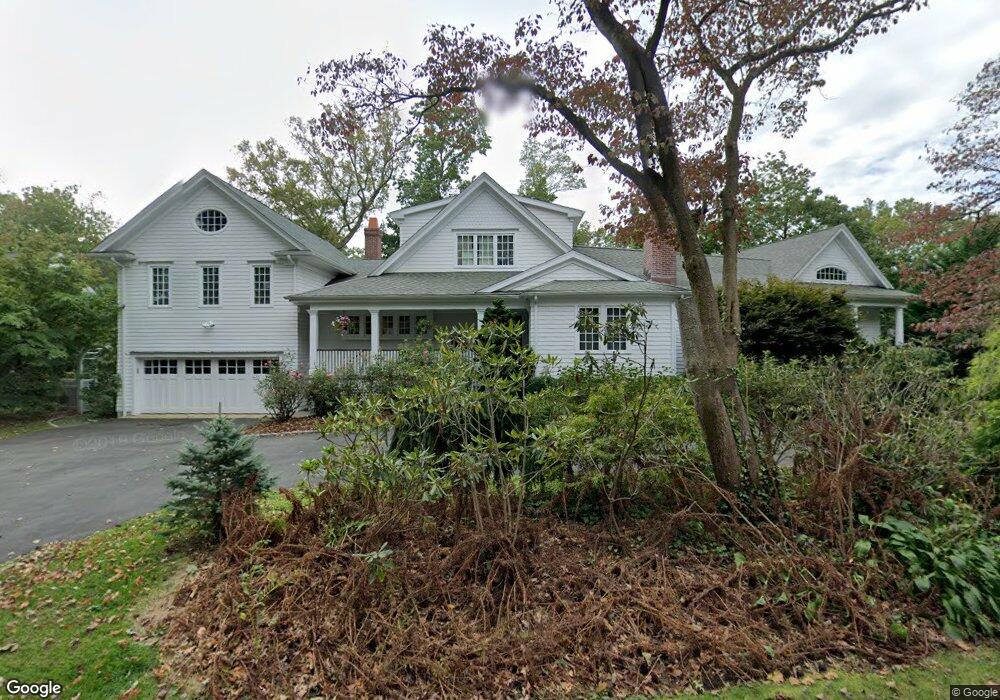
28 Irvine Rd Old Greenwich, CT 06870
Old Greenwich NeighborhoodEstimated Value: $2,526,000 - $4,671,000
3
Beds
4
Baths
4,538
Sq Ft
$879/Sq Ft
Est. Value
About This Home
This home is located at 28 Irvine Rd, Old Greenwich, CT 06870 and is currently estimated at $3,988,631, approximately $878 per square foot. 28 Irvine Rd is a home located in Fairfield County with nearby schools including Old Greenwich School, Eastern Middle School, and Greenwich High School.
Ownership History
Date
Name
Owned For
Owner Type
Purchase Details
Closed on
Dec 29, 1995
Sold by
Atwood Charles L and Atwood Carol F
Bought by
Harckkham Palmer Sloan and Harckham Finley Tr
Current Estimated Value
Purchase Details
Closed on
Jul 1, 1993
Sold by
Jain Ajit
Bought by
Atwood Charles
Create a Home Valuation Report for This Property
The Home Valuation Report is an in-depth analysis detailing your home's value as well as a comparison with similar homes in the area
Home Values in the Area
Average Home Value in this Area
Purchase History
| Date | Buyer | Sale Price | Title Company |
|---|---|---|---|
| Harckkham Palmer Sloan | $535,000 | -- | |
| Atwood Charles | $455,000 | -- |
Source: Public Records
Mortgage History
| Date | Status | Borrower | Loan Amount |
|---|---|---|---|
| Open | Atwood Charles | $1,460,000 | |
| Closed | Atwood Charles | $1,482,000 | |
| Closed | Atwood Charles | $1,500,000 |
Source: Public Records
Tax History Compared to Growth
Tax History
| Year | Tax Paid | Tax Assessment Tax Assessment Total Assessment is a certain percentage of the fair market value that is determined by local assessors to be the total taxable value of land and additions on the property. | Land | Improvement |
|---|---|---|---|---|
| 2025 | $20,844 | $1,686,510 | $1,040,060 | $646,450 |
| 2024 | $20,130 | $1,686,510 | $1,040,060 | $646,450 |
| 2023 | $19,624 | $1,686,510 | $1,040,060 | $646,450 |
| 2022 | $19,445 | $1,686,510 | $1,040,060 | $646,450 |
| 2021 | $19,634 | $1,630,720 | $910,420 | $720,300 |
| 2020 | $19,601 | $1,630,720 | $910,420 | $720,300 |
| 2019 | $19,797 | $1,630,720 | $910,420 | $720,300 |
| 2018 | $19,357 | $1,630,720 | $910,420 | $720,300 |
| 2017 | $19,600 | $1,630,720 | $910,420 | $720,300 |
| 2016 | $19,290 | $1,630,720 | $910,420 | $720,300 |
| 2015 | $16,419 | $1,376,830 | $995,750 | $381,080 |
| 2014 | $15,941 | $1,371,230 | $995,750 | $375,480 |
Source: Public Records
Map
Nearby Homes