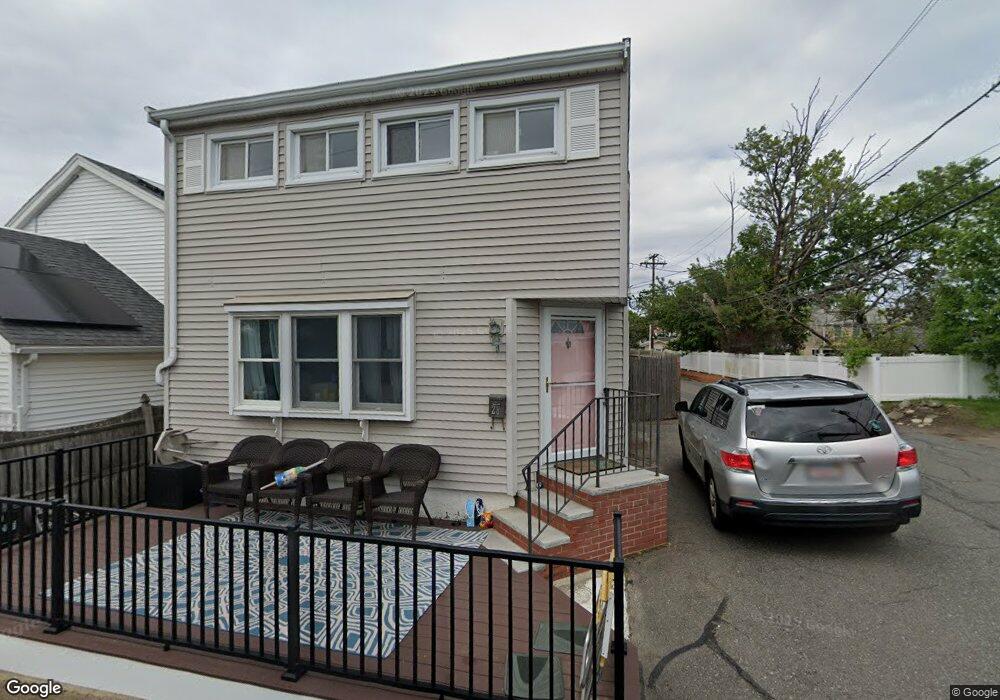
28 James Ave Nahant, MA 01908
Estimated Value: $510,774 - $654,000
2
Beds
2
Baths
985
Sq Ft
$594/Sq Ft
Est. Value
About This Home
This home is located at 28 James Ave, Nahant, MA 01908 and is currently estimated at $584,694, approximately $593 per square foot. 28 James Ave is a home located in Essex County with nearby schools including Johnson Elementary School, Swampscott Middle School, and Swampscott High School.
Ownership History
Date
Name
Owned For
Owner Type
Purchase Details
Closed on
Feb 19, 2020
Sold by
Campbell Gail
Bought by
Gail Campbell Ret and Campbell
Current Estimated Value
Purchase Details
Closed on
Sep 22, 2017
Sold by
Campbell Erica
Bought by
Campbell Gail
Purchase Details
Closed on
Feb 13, 2009
Sold by
Sutcliffe Sharon
Bought by
Campbell Erica
Home Financials for this Owner
Home Financials are based on the most recent Mortgage that was taken out on this home.
Original Mortgage
$225,097
Interest Rate
5.26%
Mortgage Type
Purchase Money Mortgage
Purchase Details
Closed on
Apr 16, 1998
Sold by
Cullinan Michael and Moleti John F
Bought by
Sutcliffe Sharon
Create a Home Valuation Report for This Property
The Home Valuation Report is an in-depth analysis detailing your home's value as well as a comparison with similar homes in the area
Home Values in the Area
Average Home Value in this Area
Purchase History
| Date | Buyer | Sale Price | Title Company |
|---|---|---|---|
| Gail Campbell Ret | -- | None Available | |
| Gail Campbell Ret | -- | None Available | |
| Gail Campbell Ret | -- | None Available | |
| Campbell Gail | $29,000 | -- | |
| Campbell Gail | $29,000 | -- | |
| Campbell Erica | $229,250 | -- | |
| Campbell Erica | $229,250 | -- | |
| Sutcliffe Sharon | $124,000 | -- | |
| Sutcliffe Sharon J | $124,000 | -- |
Source: Public Records
Mortgage History
| Date | Status | Borrower | Loan Amount |
|---|---|---|---|
| Previous Owner | Sutcliffe Sharon J | $212,000 | |
| Previous Owner | Sutcliffe Sharon J | $225,097 |
Source: Public Records
Tax History
| Year | Tax Paid | Tax Assessment Tax Assessment Total Assessment is a certain percentage of the fair market value that is determined by local assessors to be the total taxable value of land and additions on the property. | Land | Improvement |
|---|---|---|---|---|
| 2025 | $4,236 | $462,900 | $290,000 | $172,900 |
| 2024 | $4,086 | $450,500 | $277,600 | $172,900 |
| 2023 | $3,711 | $408,200 | $246,800 | $161,400 |
| 2022 | $3,477 | $355,200 | $209,800 | $145,400 |
| 2021 | $3,511 | $334,100 | $197,400 | $136,700 |
| 2020 | $3,322 | $302,800 | $185,100 | $117,700 |
| 2019 | $3,038 | $278,500 | $172,700 | $105,800 |
| 2018 | $2,830 | $276,100 | $172,700 | $103,400 |
| 2017 | $2,891 | $276,100 | $172,700 | $103,400 |
| 2016 | $2,594 | $246,600 | $151,200 | $95,400 |
| 2015 | $2,575 | $235,800 | $140,400 | $95,400 |
| 2014 | $2,461 | $223,100 | $127,700 | $95,400 |
Source: Public Records
Map
Nearby Homes
- 36 Lennox Rd
- 129A Wilson Rd
- 51 Fox Hill Rd
- 75 Castle Rd
- 43 Maple Ave
- 66 Ocean St
- 85 Willow Rd
- 1 Goddard Dr
- 5 Cottage St
- 303 Nahant Rd
- 162 Willow Rd Unit 11
- 6 Desmond Dr
- 51 Cliff St
- 98 Lynnway
- 150 Lynnway Unit 403
- 150 Lynnway Unit 702
- 150 Lynnway Unit 406
- 154 Lynnway Unit 210
- 154 Lynnway Unit 401
- 154 Lynnway Unit 205
Your Personal Tour Guide
Ask me questions while you tour the home.