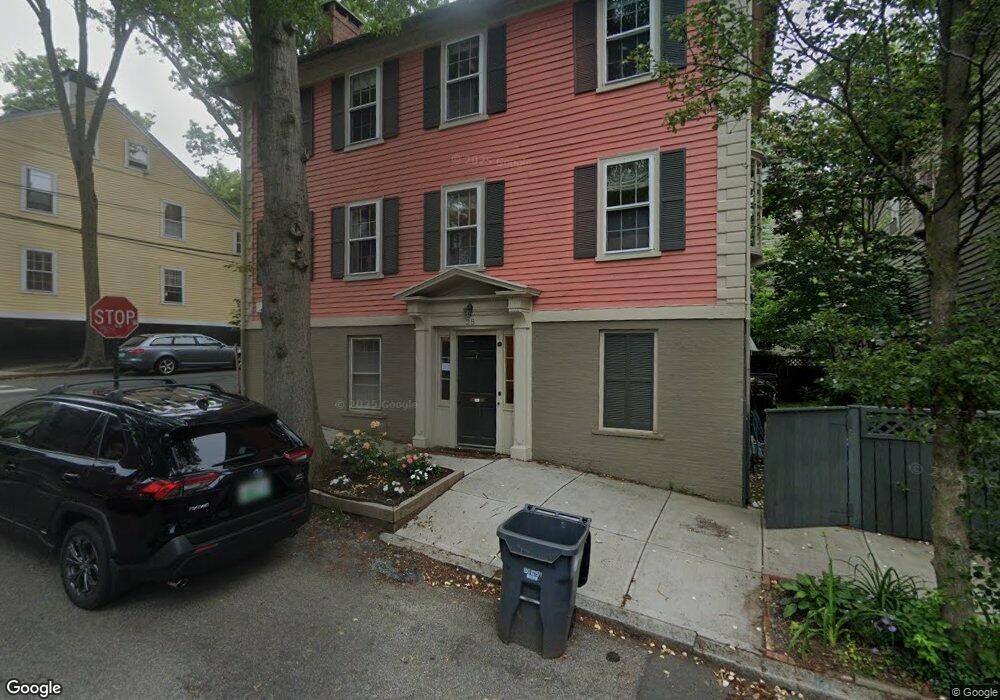
28 John St Providence, RI 02906
College Hill NeighborhoodEstimated Value: $1,070,000 - $1,091,000
4
Beds
4
Baths
3,000
Sq Ft
$361/Sq Ft
Est. Value
About This Home
This home is located at 28 John St, Providence, RI 02906 and is currently estimated at $1,083,274, approximately $361 per square foot. 28 John St is a home located in Providence County with nearby schools including French-American School of Rhode Island, Wheeler School, and Moses Brown School.
Ownership History
Date
Name
Owned For
Owner Type
Purchase Details
Closed on
Oct 13, 2009
Sold by
Simmering-Moxham D M
Bought by
Deborah M Moxham T
Current Estimated Value
Purchase Details
Closed on
Apr 28, 1997
Sold by
Morash Jason V
Bought by
Simmering Deborah M and Gordon Simmering F
Home Financials for this Owner
Home Financials are based on the most recent Mortgage that was taken out on this home.
Original Mortgage
$212,000
Interest Rate
7.77%
Purchase Details
Closed on
Feb 29, 1996
Sold by
Green David B and Green Myrth
Bought by
Morash Jason V
Home Financials for this Owner
Home Financials are based on the most recent Mortgage that was taken out on this home.
Original Mortgage
$175,000
Interest Rate
7.02%
Create a Home Valuation Report for This Property
The Home Valuation Report is an in-depth analysis detailing your home's value as well as a comparison with similar homes in the area
Home Values in the Area
Average Home Value in this Area
Purchase History
We collect this data history from publicly available records. To have your information removed, we recommend requesting removal directly through your county’s website.
| Date | Buyer | Sale Price | Title Company |
|---|---|---|---|
| Deborah M Moxham T | -- | -- | |
| Simmering Deborah M | $265,000 | -- | |
| Morash Jason V | $175,000 | -- |
Source: Public Records
Mortgage History
We collect this data history from publicly available records. To have your information removed, we recommend requesting removal directly through your county’s website.
| Date | Status | Borrower | Loan Amount |
|---|---|---|---|
| Open | Morash Jason V | $100,000 | |
| Previous Owner | Morash Jason V | $212,000 | |
| Previous Owner | Morash Jason V | $175,000 |
Source: Public Records
Tax History
| Year | Tax Paid | Tax Assessment Tax Assessment Total Assessment is a certain percentage of the fair market value that is determined by local assessors to be the total taxable value of land and additions on the property. | Land | Improvement |
|---|---|---|---|---|
| 2025 | $7,734 | $920,700 | $526,700 | $394,000 |
| 2024 | $12,344 | $672,700 | $370,600 | $302,100 |
| 2023 | $12,344 | $672,700 | $370,600 | $302,100 |
| 2022 | $11,974 | $672,700 | $370,600 | $302,100 |
| 2021 | $13,798 | $561,800 | $261,400 | $300,400 |
| 2020 | $13,798 | $561,800 | $261,400 | $300,400 |
| 2019 | $13,798 | $561,800 | $261,400 | $300,400 |
| 2018 | $14,372 | $449,700 | $248,400 | $201,300 |
| 2017 | $14,372 | $449,700 | $248,400 | $201,300 |
| 2016 | $14,372 | $449,700 | $248,400 | $201,300 |
| 2015 | $16,004 | $483,500 | $259,200 | $224,300 |
| 2014 | $16,318 | $483,500 | $259,200 | $224,300 |
| 2013 | $16,318 | $483,500 | $259,200 | $224,300 |
Source: Public Records
Map
Nearby Homes
- 86 Transit St
- 84 Transit St
- 407 Benefit St
- 87 Hope St
- 10 East St Unit 13
- 230 S Main St Unit 4
- 374 Wickenden St
- 555 S Water St Unit 235
- 555 S Water St Unit 212
- 64 Governor St
- 66 Armstrong Ave
- 427 Wickenden St
- 85 Governor St
- 21 George St
- 281 Benefit St Unit B
- 41 E Transit St
- 42 Fremont St
- 5 Amy St
- 14 Amy St
- 45 E George St
Your Personal Tour Guide
Ask me questions while you tour the home.