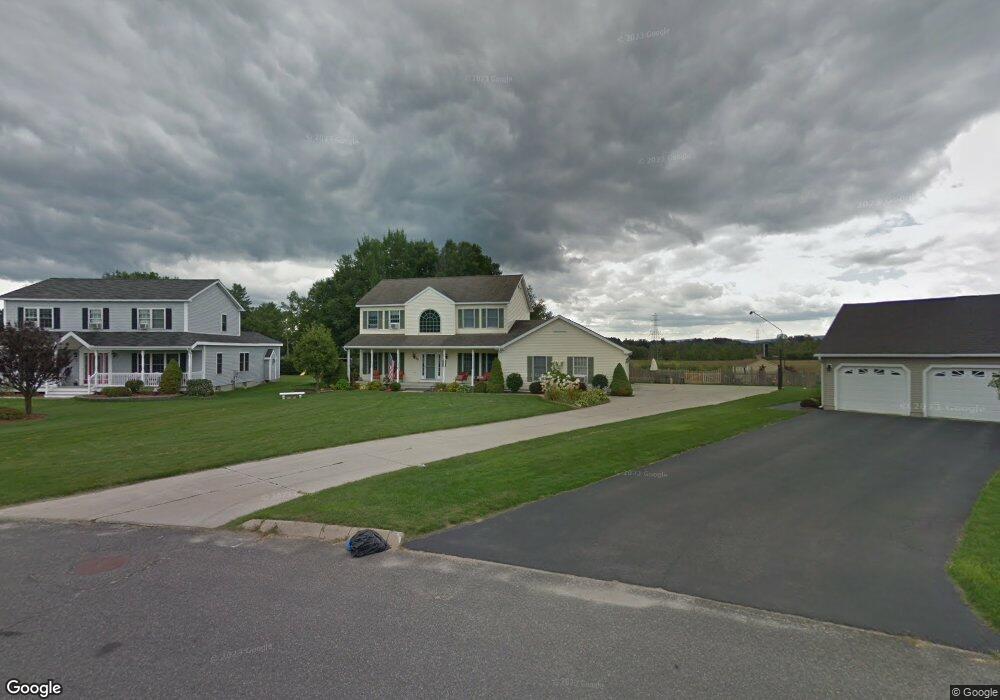
28 Kathy Way Pittsfield, MA 01201
Estimated Value: $522,000 - $695,000
4
Beds
3
Baths
2,080
Sq Ft
$291/Sq Ft
Est. Value
About This Home
This home is located at 28 Kathy Way, Pittsfield, MA 01201 and is currently estimated at $606,237, approximately $291 per square foot. 28 Kathy Way is a home located in Berkshire County with nearby schools including Egremont Elementary School, Theodore Herberg Middle School, and Sinai Academy of the Berkshires.
Ownership History
Date
Name
Owned For
Owner Type
Purchase Details
Closed on
Apr 11, 2003
Sold by
Wuebbels Amy R and Wuebbels Brian A
Bought by
Salvie James and Salvie Nicole
Current Estimated Value
Home Financials for this Owner
Home Financials are based on the most recent Mortgage that was taken out on this home.
Original Mortgage
$332,000
Outstanding Balance
$142,518
Interest Rate
5.86%
Mortgage Type
Purchase Money Mortgage
Estimated Equity
$463,719
Create a Home Valuation Report for This Property
The Home Valuation Report is an in-depth analysis detailing your home's value as well as a comparison with similar homes in the area
Home Values in the Area
Average Home Value in this Area
Purchase History
| Date | Buyer | Sale Price | Title Company |
|---|---|---|---|
| Salvie James | $253,126 | -- | |
| Salvie James | $253,126 | -- | |
| Salvie James | $253,126 | -- |
Source: Public Records
Mortgage History
| Date | Status | Borrower | Loan Amount |
|---|---|---|---|
| Open | Salvie James | $80,000 | |
| Open | Salvie James | $332,000 | |
| Closed | Salvie James | $332,000 | |
| Previous Owner | Salvie James | $31,000 |
Source: Public Records
Tax History Compared to Growth
Tax History
| Year | Tax Paid | Tax Assessment Tax Assessment Total Assessment is a certain percentage of the fair market value that is determined by local assessors to be the total taxable value of land and additions on the property. | Land | Improvement |
|---|---|---|---|---|
| 2025 | $9,512 | $530,200 | $78,700 | $451,500 |
| 2024 | $8,542 | $463,000 | $78,700 | $384,300 |
| 2023 | $7,901 | $431,300 | $78,700 | $352,600 |
| 2022 | $7,149 | $385,200 | $78,700 | $306,500 |
| 2021 | $7,436 | $386,300 | $78,700 | $307,600 |
| 2020 | $7,470 | $379,000 | $78,700 | $300,300 |
| 2019 | $7,094 | $365,300 | $78,700 | $286,600 |
| 2018 | $7,004 | $350,000 | $73,700 | $276,300 |
| 2017 | $6,494 | $330,800 | $73,700 | $257,100 |
| 2016 | $6,318 | $336,800 | $73,700 | $263,100 |
| 2015 | $5,897 | $326,500 | $73,700 | $252,800 |
Source: Public Records
Map
Nearby Homes