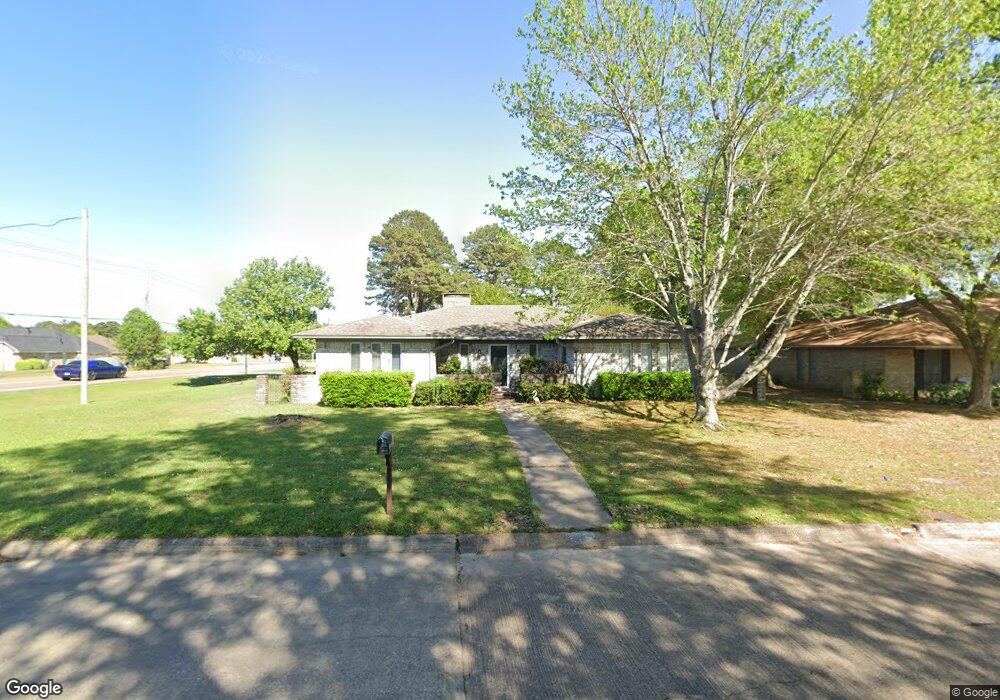
28 Lanshire Dr Texarkana, TX 75503
Estimated Value: $204,209 - $263,000
--
Bed
--
Bath
1,794
Sq Ft
$130/Sq Ft
Est. Value
About This Home
This home is located at 28 Lanshire Dr, Texarkana, TX 75503 and is currently estimated at $232,552, approximately $129 per square foot. 28 Lanshire Dr is a home located in Bowie County with nearby schools including Margaret Fischer Davis Elementary School, Pleasant Grove Intermediate School, and Pleasant Grove Middle School.
Ownership History
Date
Name
Owned For
Owner Type
Purchase Details
Closed on
May 17, 2016
Sold by
Hunt Ernest Theodore and Schley Marilyn P Hunt
Bought by
Treadway Gary W
Current Estimated Value
Purchase Details
Closed on
Aug 6, 2014
Sold by
Schley Marilyn P and Hunt Marilyn P
Bought by
Hunt Ernest T
Home Financials for this Owner
Home Financials are based on the most recent Mortgage that was taken out on this home.
Original Mortgage
$110,400
Interest Rate
4.75%
Mortgage Type
Adjustable Rate Mortgage/ARM
Purchase Details
Closed on
Jun 1, 2014
Sold by
Schley Marilyn P and Hunt Marilyn P
Bought by
Hunt Ernest T
Purchase Details
Closed on
Apr 8, 2005
Sold by
Bizub Richard J and Bizub Louise A
Bought by
Hunt Ernest Theodore and Hunt Marilyn Pearl
Create a Home Valuation Report for This Property
The Home Valuation Report is an in-depth analysis detailing your home's value as well as a comparison with similar homes in the area
Home Values in the Area
Average Home Value in this Area
Purchase History
| Date | Buyer | Sale Price | Title Company |
|---|---|---|---|
| Treadway Gary W | -- | Stewart Title | |
| Hunt Ernest T | -- | Stewart Title | |
| Hunt Ernest T | -- | None Available | |
| Hunt Ernest Theodore | -- | None Available |
Source: Public Records
Mortgage History
| Date | Status | Borrower | Loan Amount |
|---|---|---|---|
| Previous Owner | Hunt Ernest T | $110,400 |
Source: Public Records
Tax History Compared to Growth
Tax History
| Year | Tax Paid | Tax Assessment Tax Assessment Total Assessment is a certain percentage of the fair market value that is determined by local assessors to be the total taxable value of land and additions on the property. | Land | Improvement |
|---|---|---|---|---|
| 2025 | $3,950 | $181,867 | $25,000 | $156,867 |
| 2024 | $3,950 | $177,468 | $25,000 | $152,468 |
| 2023 | $3,882 | $172,434 | $25,000 | $147,434 |
| 2022 | $3,860 | $157,187 | $25,000 | $132,187 |
| 2021 | $3,548 | $135,675 | $25,000 | $110,675 |
| 2020 | $3,473 | $132,106 | $25,000 | $107,106 |
| 2019 | $3,431 | $127,181 | $25,000 | $102,181 |
| 2018 | $3,283 | $122,388 | $24,000 | $98,388 |
| 2017 | $3,224 | $120,537 | $24,000 | $96,537 |
| 2016 | $3,152 | $117,835 | $24,000 | $93,835 |
| 2015 | $2,410 | $117,908 | $24,000 | $93,908 |
| 2014 | $2,410 | $117,024 | $24,000 | $93,024 |
Source: Public Records
Map
Nearby Homes
- 26 Lanshire Dr
- 35 Heatherwood Dr
- 24 Lanshire Dr
- 25 Lanshire Dr
- 22 Lanshire Dr
- 30 Lanshire Dr
- 30 Lanshire Dr Unit 30 Lanshire
- 23 Lanshire Dr
- 31 Lanshire Dr
- 31 Heatherwood Dr
- 20 Lanshire Dr
- 31 Fernwood Dr
- 24 Heatherwood Dr
- 21 Lanshire Dr
- 32 Lanshire Dr
- 33 Lanshire Dr
- 33 Fernwood Dr
- 18 Lanshire Dr
- 0 Fernwood Dr
- 29 Heatherwood Dr