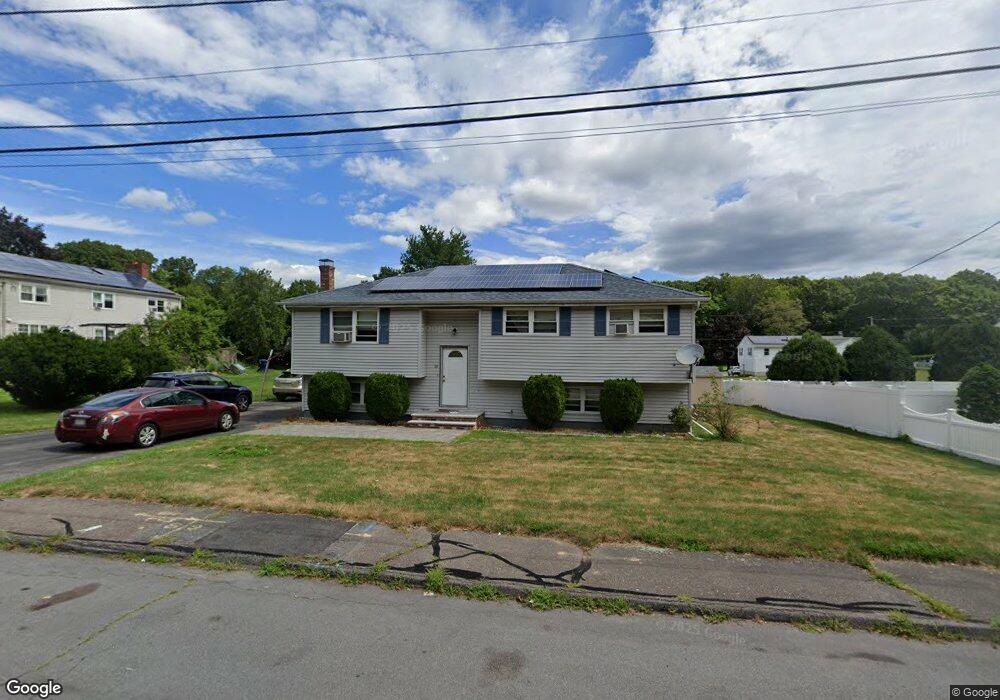
28 Mark Terrace Randolph, MA 02368
Downtown Randolph NeighborhoodEstimated Value: $555,000 - $689,000
3
Beds
2
Baths
1,532
Sq Ft
$401/Sq Ft
Est. Value
About This Home
This home is located at 28 Mark Terrace, Randolph, MA 02368 and is currently estimated at $614,063, approximately $400 per square foot. 28 Mark Terrace is a home located in Norfolk County with nearby schools including Randolph High School and Lighthouse Baptist Christian Academy.
Ownership History
Date
Name
Owned For
Owner Type
Purchase Details
Closed on
Oct 12, 2023
Sold by
Romain Rose L
Bought by
Rose L Romain Irt and Romain
Current Estimated Value
Purchase Details
Closed on
Nov 6, 2017
Sold by
Charles Acelhomme
Bought by
Romain Rose L
Purchase Details
Closed on
Jan 31, 2002
Sold by
Laplanche Dominique
Bought by
Romain Rose L
Home Financials for this Owner
Home Financials are based on the most recent Mortgage that was taken out on this home.
Original Mortgage
$199,800
Interest Rate
7.15%
Mortgage Type
Purchase Money Mortgage
Purchase Details
Closed on
Jul 6, 1998
Sold by
Boyce Cheryl A
Bought by
Lucien Dominique and Lucien Charlot
Home Financials for this Owner
Home Financials are based on the most recent Mortgage that was taken out on this home.
Original Mortgage
$123,000
Interest Rate
7.04%
Mortgage Type
Purchase Money Mortgage
Create a Home Valuation Report for This Property
The Home Valuation Report is an in-depth analysis detailing your home's value as well as a comparison with similar homes in the area
Home Values in the Area
Average Home Value in this Area
Purchase History
| Date | Buyer | Sale Price | Title Company |
|---|---|---|---|
| Rose L Romain Irt | -- | None Available | |
| Romain Rose L | $25,000 | -- | |
| Romain Rose L | $222,000 | -- | |
| Lucien Dominique | $143,000 | -- | |
| Lucien Dominique | $143,000 | -- |
Source: Public Records
Mortgage History
| Date | Status | Borrower | Loan Amount |
|---|---|---|---|
| Previous Owner | Lucien Dominique | $14,000 | |
| Previous Owner | Romain Rose L | $199,800 | |
| Previous Owner | Lucien Dominique | $123,000 |
Source: Public Records
Tax History Compared to Growth
Tax History
| Year | Tax Paid | Tax Assessment Tax Assessment Total Assessment is a certain percentage of the fair market value that is determined by local assessors to be the total taxable value of land and additions on the property. | Land | Improvement |
|---|---|---|---|---|
| 2025 | $6,193 | $533,400 | $244,000 | $289,400 |
| 2024 | $6,067 | $529,900 | $239,300 | $290,600 |
| 2023 | $5,748 | $475,800 | $217,600 | $258,200 |
| 2022 | $5,522 | $406,000 | $181,500 | $224,500 |
| 2021 | $5,282 | $357,400 | $151,100 | $206,300 |
| 2020 | $5,142 | $344,900 | $151,100 | $193,800 |
| 2019 | $5,060 | $337,800 | $144,000 | $193,800 |
| 2018 | $4,832 | $304,300 | $133,200 | $171,100 |
| 2017 | $4,799 | $296,600 | $126,900 | $169,700 |
| 2016 | $4,671 | $268,600 | $115,400 | $153,200 |
| 2015 | $4,568 | $252,400 | $109,900 | $142,500 |
Source: Public Records
Map
Nearby Homes