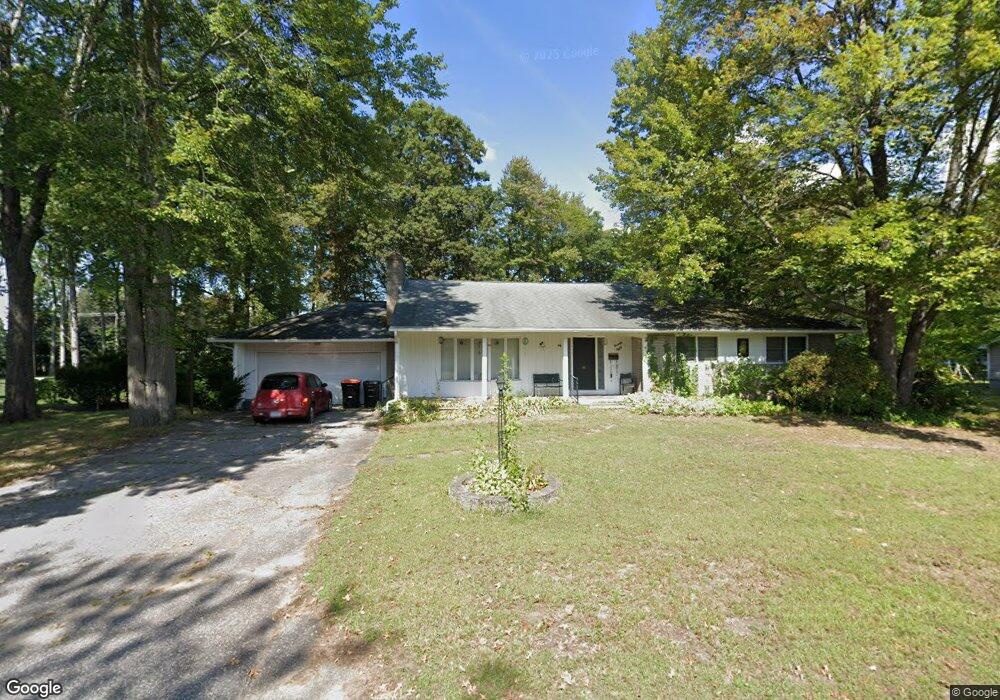
28 Michael Dr South Hadley, MA 01075
Estimated Value: $408,000 - $456,285
3
Beds
3
Baths
1,551
Sq Ft
$278/Sq Ft
Est. Value
About This Home
This home is located at 28 Michael Dr, South Hadley, MA 01075 and is currently estimated at $430,821, approximately $277 per square foot. 28 Michael Dr is a home located in Hampshire County with nearby schools including Plains Elementary School, Mosier Elementary School, and Michael E. Smith Middle School.
Ownership History
Date
Name
Owned For
Owner Type
Purchase Details
Closed on
Apr 3, 2024
Sold by
Giannetti Lisa A and Giannetti Anthony E
Bought by
Giannetti Leonard J
Current Estimated Value
Purchase Details
Closed on
Dec 31, 2019
Sold by
Giannetti Joan A
Bought by
Giannetti Lisa A and Giannetti Anthony E
Purchase Details
Closed on
Oct 26, 2017
Sold by
Giannetti Leonard J
Bought by
Giannetti Joan A
Purchase Details
Closed on
Oct 31, 1966
Bought by
Giannetti Leonard J and Giannetti Joan A
Create a Home Valuation Report for This Property
The Home Valuation Report is an in-depth analysis detailing your home's value as well as a comparison with similar homes in the area
Home Values in the Area
Average Home Value in this Area
Purchase History
| Date | Buyer | Sale Price | Title Company |
|---|---|---|---|
| Giannetti Leonard J | -- | None Available | |
| Giannetti Lisa A | -- | None Available | |
| Giannetti Joan A | -- | -- | |
| Giannetti Leonard J | -- | -- |
Source: Public Records
Mortgage History
| Date | Status | Borrower | Loan Amount |
|---|---|---|---|
| Previous Owner | Giannetti Leonard J | $95,000 |
Source: Public Records
Tax History Compared to Growth
Tax History
| Year | Tax Paid | Tax Assessment Tax Assessment Total Assessment is a certain percentage of the fair market value that is determined by local assessors to be the total taxable value of land and additions on the property. | Land | Improvement |
|---|---|---|---|---|
| 2025 | $6,902 | $433,300 | $141,700 | $291,600 |
| 2024 | $6,911 | $415,100 | $132,600 | $282,500 |
| 2023 | $6,214 | $354,100 | $120,300 | $233,800 |
| 2022 | $5,938 | $321,300 | $120,300 | $201,000 |
| 2021 | $5,854 | $300,800 | $112,600 | $188,200 |
| 2020 | $6,034 | $302,600 | $112,600 | $190,000 |
| 2019 | $5,713 | $283,500 | $107,200 | $176,300 |
| 2018 | $5,503 | $276,100 | $104,300 | $171,800 |
| 2017 | $5,308 | $263,800 | $104,300 | $159,500 |
| 2016 | $5,032 | $253,500 | $95,200 | $158,300 |
| 2015 | $4,777 | $246,500 | $92,600 | $153,900 |
Source: Public Records
Map
Nearby Homes