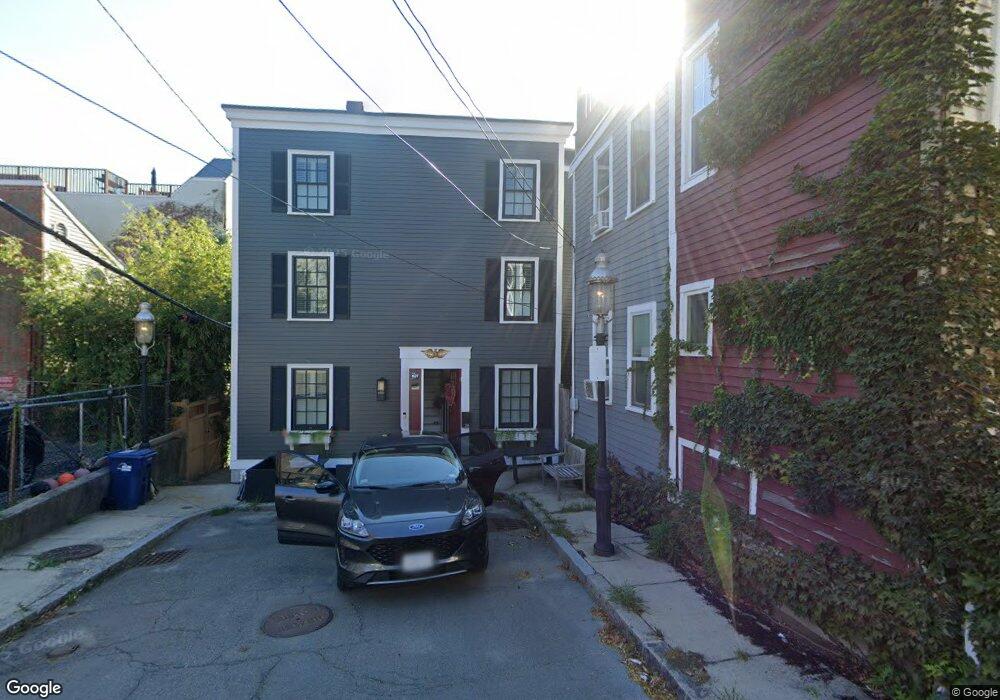
28 Monument Ct Charlestown, MA 02129
Thompson Square-Bunker Hill NeighborhoodEstimated Value: $1,654,925 - $2,355,000
4
Beds
2
Baths
2,010
Sq Ft
$961/Sq Ft
Est. Value
About This Home
This home is located at 28 Monument Ct, Charlestown, MA 02129 and is currently estimated at $1,931,231, approximately $960 per square foot. 28 Monument Ct is a home located in Suffolk County with nearby schools including Boston Children's School and St John School.
Ownership History
Date
Name
Owned For
Owner Type
Purchase Details
Closed on
Jun 30, 2008
Sold by
Barnet Alan L
Bought by
White Merry and White Peter
Current Estimated Value
Purchase Details
Closed on
Jul 17, 2003
Sold by
Ross Dori H and Morton Forbes H
Bought by
Barnet Alan L
Purchase Details
Closed on
Mar 31, 1999
Sold by
Gannon Mary A
Bought by
Ross Dori H and Morton Forbes H
Create a Home Valuation Report for This Property
The Home Valuation Report is an in-depth analysis detailing your home's value as well as a comparison with similar homes in the area
Home Values in the Area
Average Home Value in this Area
Purchase History
| Date | Buyer | Sale Price | Title Company |
|---|---|---|---|
| White Merry | $725,000 | -- | |
| Barnet Alan L | $580,000 | -- | |
| Ross Dori H | $413,000 | -- |
Source: Public Records
Mortgage History
| Date | Status | Borrower | Loan Amount |
|---|---|---|---|
| Open | Ross Dori H | $404,000 | |
| Closed | Ross Dori H | $411,000 | |
| Closed | Ross Dori H | $100,000 |
Source: Public Records
Tax History Compared to Growth
Tax History
| Year | Tax Paid | Tax Assessment Tax Assessment Total Assessment is a certain percentage of the fair market value that is determined by local assessors to be the total taxable value of land and additions on the property. | Land | Improvement |
|---|---|---|---|---|
| 2025 | $14,001 | $1,209,100 | $484,000 | $725,100 |
| 2024 | $14,127 | $1,296,100 | $440,600 | $855,500 |
| 2023 | $12,889 | $1,200,100 | $408,000 | $792,100 |
| 2022 | $11,870 | $1,091,000 | $370,900 | $720,100 |
| 2021 | $11,641 | $1,091,000 | $370,900 | $720,100 |
| 2020 | $8,973 | $849,700 | $341,800 | $507,900 |
| 2019 | $8,784 | $833,400 | $275,600 | $557,800 |
| 2018 | $8,163 | $778,900 | $275,600 | $503,300 |
| 2017 | $8,010 | $756,400 | $275,600 | $480,800 |
| 2016 | $7,498 | $681,600 | $275,600 | $406,000 |
| 2015 | $8,093 | $668,300 | $269,100 | $399,200 |
| 2014 | $7,494 | $595,700 | $269,100 | $326,600 |
Source: Public Records
Map
Nearby Homes
- 5 Wallace Ct
- 46 High St
- 17 Henley St Unit F
- 17 Henley St Unit B
- 12 Prospect St Unit 2
- 12 Prospect St Unit 1
- 56 High St Unit 3
- 73 Chelsea St Unit 401
- 106 Bunker Hill St Unit 2
- 106 Bunker Hill St Unit 6
- 106 Bunker Hill St Unit 1
- 106 Bunker Hill St Unit 4P
- 106 Bunker Hill St Unit 3
- 22 Harvard St
- 172 Bunker Hill St Unit 1
- 1 Washington Place
- 207 Bunker Hill St Unit 2
- 9 Russell St Unit 2
- 9 Russell St Unit 1
- 247 Bunker Hill St Unit A
- 39 Soley St Unit 2
- 39 Soley St
- 35 Soley St
- 35 Soley St Unit 1
- 21 Monument Ct Unit 1
- 41 Soley St
- 33 Soley St Unit 2
- 33 Soley St Unit 1
- 44 Winthrop St
- 42 Winthrop St
- 42 Winthrop St Unit 1
- 42 Winthrop St Unit 2
- 31 Soley St
- 31 Soley St Unit 1
- 31 Soley St Unit 3
- 43 Soley St Unit 3
- 43 Soley St Unit 2
- 43 Soley St Unit 1
- 40 Winthrop St
- 45 Soley St