Estimated Value: $114,803 - $247,000
--
Bed
--
Bath
1,027
Sq Ft
$168/Sq Ft
Est. Value
About This Home
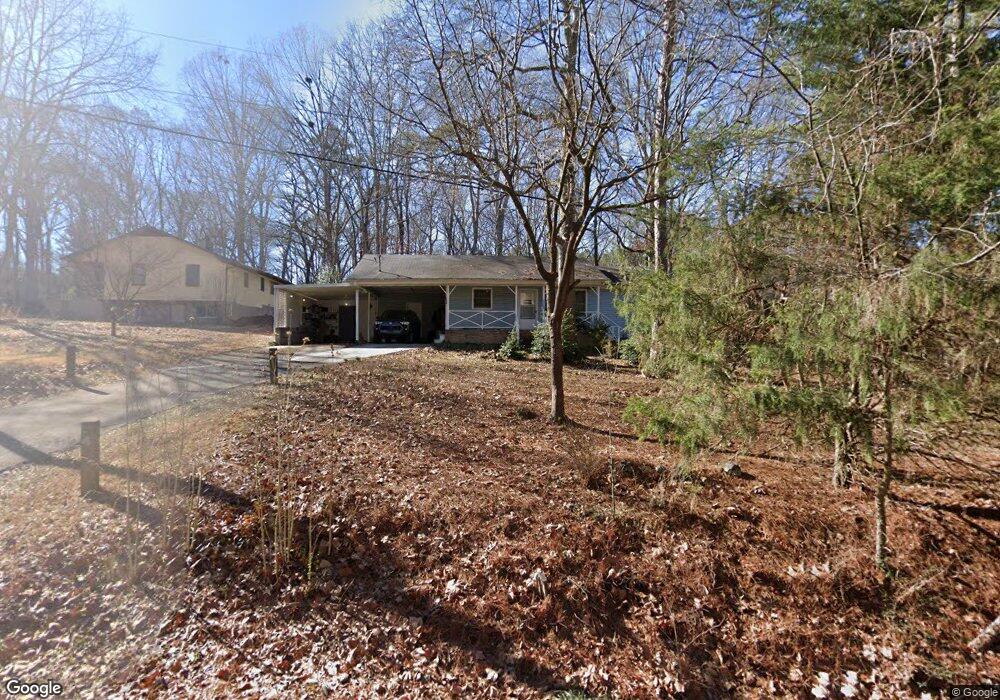
This home is located at 28 Nancy St SE, Rome, GA 30161 and is currently estimated at $172,951, approximately $168 per square foot. 28 Nancy St SE is a home located in Floyd County with nearby schools including Pepperell Middle School, Pepperell High School, and Montessori School of Rome.
Ownership History
Date
Name
Owned For
Owner Type
Purchase Details
Closed on
Aug 17, 1995
Bought by
P and R
Current Estimated Value
Purchase Details
Closed on
Jul 20, 1995
Sold by
Mccleskey Mccleskey J and Mccleskey Cathy E
Bought by
Mccleskey J D
Purchase Details
Closed on
Jan 1, 1985
Sold by
Mccord J C
Bought by
Mccleskey Mccleskey J and Mccleskey Cathy E
Purchase Details
Closed on
Aug 26, 1981
Sold by
Mccord C L
Bought by
Mccord J C
Purchase Details
Closed on
Aug 2, 1981
Bought by
P and R
Purchase Details
Closed on
Apr 18, 1973
Sold by
Cash James H
Bought by
Mccord C L
Purchase Details
Closed on
Apr 17, 1973
Sold by
Bruno Trading Co Roy Gleen & Grady Brann
Bought by
Cash James H
Purchase Details
Closed on
Oct 23, 1967
Sold by
Brannon Brothers Roofing Co Inc
Bought by
Bruno Trading Co Roy Gleen & Grady Brann
Purchase Details
Closed on
Jun 19, 1967
Bought by
Brannon Brothers Roofing Co Inc
Create a Home Valuation Report for This Property
The Home Valuation Report is an in-depth analysis detailing your home's value as well as a comparison with similar homes in the area
Home Values in the Area
Average Home Value in this Area
Purchase History
| Date | Buyer | Sale Price | Title Company |
|---|---|---|---|
| P | -- | -- | |
| Mccleskey J D | -- | -- | |
| Mccleskey Mccleskey J | $35,500 | -- | |
| Mccord J C | $4,100 | -- | |
| P | -- | -- | |
| Mccord C L | $1,000 | -- | |
| Cash James H | $1,500 | -- | |
| Bruno Trading Co Roy Gleen & Grady Brann | -- | -- | |
| Brannon Brothers Roofing Co Inc | -- | -- |
Source: Public Records
Tax History Compared to Growth
Tax History
| Year | Tax Paid | Tax Assessment Tax Assessment Total Assessment is a certain percentage of the fair market value that is determined by local assessors to be the total taxable value of land and additions on the property. | Land | Improvement |
|---|---|---|---|---|
| 2024 | $209 | $41,809 | $7,018 | $34,791 |
| 2023 | $204 | $40,747 | $6,380 | $34,367 |
| 2022 | $177 | $32,949 | $5,214 | $27,735 |
| 2021 | $181 | $26,057 | $4,754 | $21,303 |
| 2020 | $599 | $24,745 | $4,134 | $20,611 |
| 2019 | $579 | $23,959 | $4,134 | $19,825 |
| 2018 | $558 | $22,735 | $3,937 | $18,798 |
| 2017 | $547 | $22,085 | $3,646 | $18,439 |
| 2016 | $552 | $22,020 | $3,640 | $18,380 |
| 2015 | $543 | $22,020 | $3,640 | $18,380 |
| 2014 | $543 | $22,020 | $3,640 | $18,380 |
Source: Public Records
Map
Nearby Homes
- 52 Twickenham Rd SE
- 36 Saddle Mountain Rd SE
- 409 Flora Ave SE
- 3014 Maple Rd SE
- 0 Wellington Way SE Unit 7374602
- 0 Wellington Way SE Unit 20180068
- 0 Wellington Way SE Unit 7374604
- 0 Wellington Way SE Unit 20180069
- 27 Saddle Mountain Rd SE
- 3 Belmont Ct SE
- 33 Summit Dr
- 15 Saddlebrook Dr SE
- 2812 Maple Rd SE
- 211 Alfred Ave SE
- 226 Flora Ave SE
- 212 Alfred Ave SE
- 36 Coventry Dr SE
- 2710 Maple Rd SE
- 13 Spring Cir SE
- 109 Chateau Dr SE
- 36 Nancy St SE
- 36 Nancy St SE
- 7 Mccord Dr SE
- 15 Nancy St SE
- 9 Nancy St SE
- 3 Nancy St SE
- 58 Nancy St SE
- 18 Mccord Dr SE
- 18 Mccord Dr SE
- 18 Mccord Dr SE
- 306 Pheasant Run SE
- 400 Pheasant Run SE
- 304 Pheasant Run SE
- 82 Nancy St SE
- 402 Pheasant Run SE
- 302 Pheasant Run SE
- 14 Mccord Dr SE
- S Pheasant Run
- 71 Nancy St SE
- 404 Pheasant Run SE