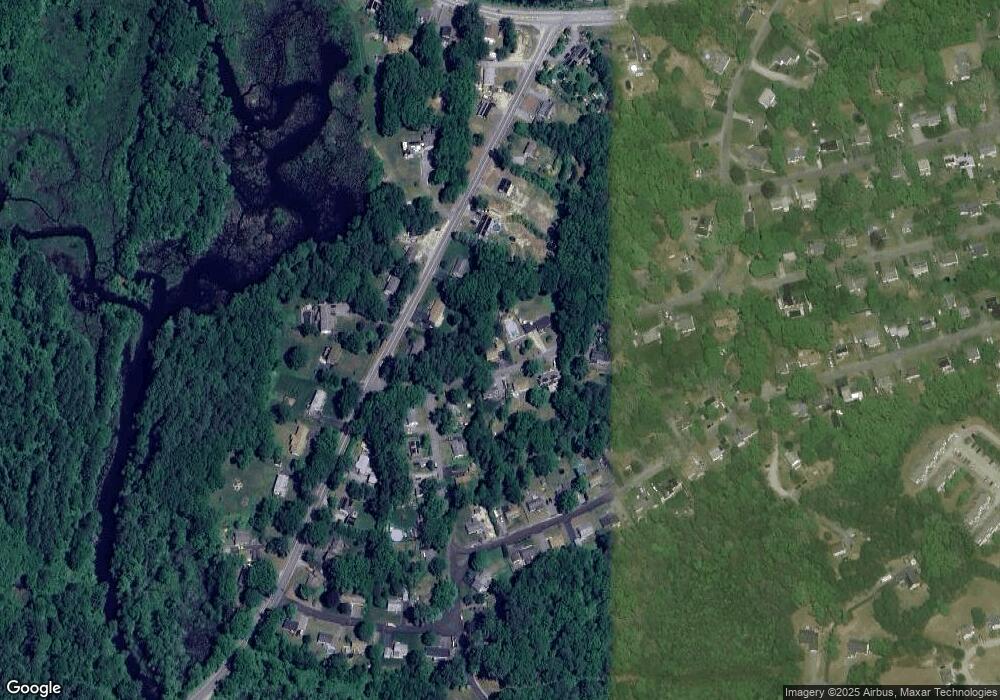
28 Old Dudley Rd Oxford, MA 01540
Estimated Value: $351,000 - $404,000
3
Beds
1
Bath
768
Sq Ft
$476/Sq Ft
Est. Value
About This Home
This home is located at 28 Old Dudley Rd, Oxford, MA 01540 and is currently estimated at $365,400, approximately $475 per square foot. 28 Old Dudley Rd is a home located in Worcester County with nearby schools including Alfred M Chaffee, Oxford High School, and Clara Barton Elementary School.
Ownership History
Date
Name
Owned For
Owner Type
Purchase Details
Closed on
Jan 31, 2020
Sold by
Mathurin Christy M
Bought by
Mathurin Rt
Current Estimated Value
Purchase Details
Closed on
Dec 28, 1973
Bought by
Mathurin Paul L and Mathurin Ruth E
Create a Home Valuation Report for This Property
The Home Valuation Report is an in-depth analysis detailing your home's value as well as a comparison with similar homes in the area
Home Values in the Area
Average Home Value in this Area
Purchase History
| Date | Buyer | Sale Price | Title Company |
|---|---|---|---|
| Mathurin Rt | -- | None Available | |
| Mathurin Christy M | -- | None Available | |
| Mathurin Paul L | -- | -- |
Source: Public Records
Mortgage History
| Date | Status | Borrower | Loan Amount |
|---|---|---|---|
| Previous Owner | Mathurin Paul L | $20,000 | |
| Previous Owner | Mathurin Paul L | $15,000 |
Source: Public Records
Tax History Compared to Growth
Tax History
| Year | Tax Paid | Tax Assessment Tax Assessment Total Assessment is a certain percentage of the fair market value that is determined by local assessors to be the total taxable value of land and additions on the property. | Land | Improvement |
|---|---|---|---|---|
| 2025 | $40 | $317,100 | $89,600 | $227,500 |
| 2024 | $4,010 | $297,500 | $85,400 | $212,100 |
| 2023 | $3,885 | $284,800 | $81,700 | $203,100 |
| 2022 | $3,893 | $240,900 | $78,500 | $162,400 |
| 2021 | $3,744 | $226,500 | $74,700 | $151,800 |
| 2020 | $3,610 | $216,700 | $74,700 | $142,000 |
| 2019 | $3,123 | $183,400 | $74,700 | $108,700 |
| 2018 | $3,167 | $183,400 | $74,700 | $108,700 |
| 2017 | $3,116 | $184,900 | $71,600 | $113,300 |
| 2016 | $3,130 | $184,900 | $71,600 | $113,300 |
| 2015 | $2,920 | $184,900 | $71,600 | $113,300 |
| 2014 | $2,841 | $189,400 | $69,700 | $119,700 |
Source: Public Records
Map
Nearby Homes