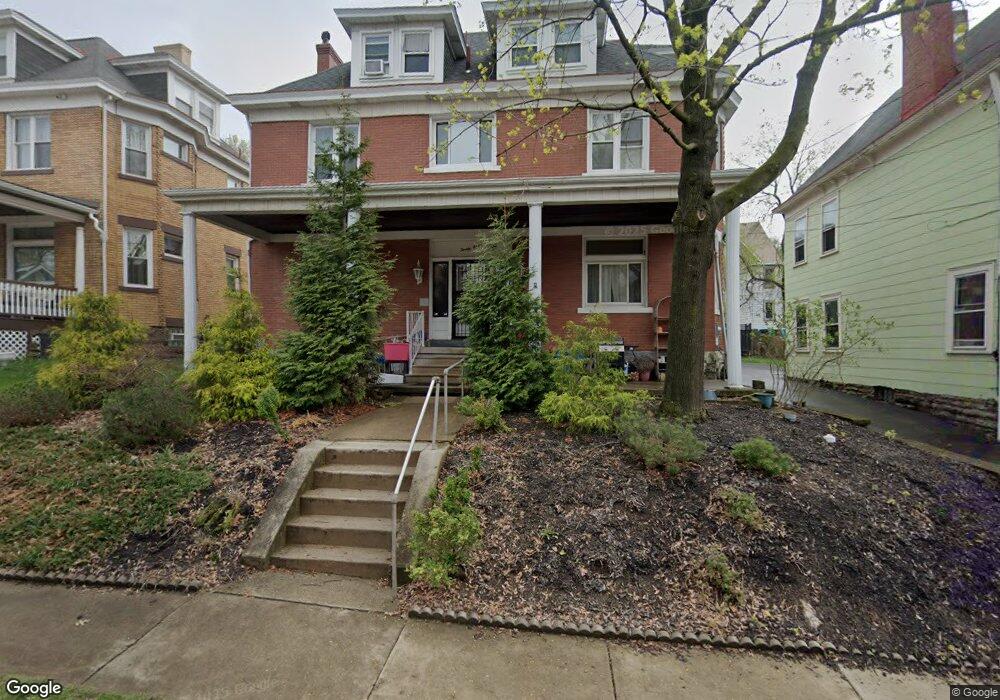
28 Oregon Ave Pittsburgh, PA 15205
Estimated Value: $250,000 - $328,000
6
Beds
3
Baths
2,785
Sq Ft
$105/Sq Ft
Est. Value
About This Home
This home is located at 28 Oregon Ave, Pittsburgh, PA 15205 and is currently estimated at $291,701, approximately $104 per square foot. 28 Oregon Ave is a home located in Allegheny County with nearby schools including Carlynton Junior/Senior High School, St. Philip School, and Al-Andalus School.
Ownership History
Date
Name
Owned For
Owner Type
Purchase Details
Closed on
Mar 24, 2009
Sold by
Federal Home Loan Mortgage Corporation
Bought by
Heffner Andrew P
Current Estimated Value
Home Financials for this Owner
Home Financials are based on the most recent Mortgage that was taken out on this home.
Original Mortgage
$86,996
Outstanding Balance
$55,347
Interest Rate
5.14%
Mortgage Type
FHA
Estimated Equity
$236,354
Purchase Details
Closed on
Oct 6, 2008
Sold by
Work Gina M
Bought by
Federal Home Loan Mortgage Corporation
Purchase Details
Closed on
Oct 1, 2004
Sold by
Counihan Stephen
Bought by
Work Harold
Home Financials for this Owner
Home Financials are based on the most recent Mortgage that was taken out on this home.
Original Mortgage
$127,000
Interest Rate
5.81%
Mortgage Type
New Conventional
Purchase Details
Closed on
May 26, 1998
Sold by
Counihan Dolores A
Bought by
Counihan Stephen F and Counihan Loretta A
Create a Home Valuation Report for This Property
The Home Valuation Report is an in-depth analysis detailing your home's value as well as a comparison with similar homes in the area
Home Values in the Area
Average Home Value in this Area
Purchase History
| Date | Buyer | Sale Price | Title Company |
|---|---|---|---|
| Heffner Andrew P | $90,000 | -- | |
| Federal Home Loan Mortgage Corporation | $2,008 | -- | |
| Work Harold | $134,000 | -- | |
| Counihan Stephen F | -- | -- |
Source: Public Records
Mortgage History
| Date | Status | Borrower | Loan Amount |
|---|---|---|---|
| Open | Heffner Andrew P | $86,996 | |
| Previous Owner | Work Harold | $127,000 |
Source: Public Records
Tax History Compared to Growth
Tax History
| Year | Tax Paid | Tax Assessment Tax Assessment Total Assessment is a certain percentage of the fair market value that is determined by local assessors to be the total taxable value of land and additions on the property. | Land | Improvement |
|---|---|---|---|---|
| 2025 | $4,203 | $104,900 | $18,500 | $86,400 |
| 2024 | $4,203 | $104,900 | $18,500 | $86,400 |
| 2023 | $4,203 | $104,900 | $18,500 | $86,400 |
| 2022 | $4,203 | $104,900 | $18,500 | $86,400 |
| 2021 | $496 | $104,900 | $18,500 | $86,400 |
| 2020 | $3,829 | $104,900 | $18,500 | $86,400 |
| 2019 | $3,758 | $104,900 | $18,500 | $86,400 |
| 2018 | $496 | $104,900 | $18,500 | $86,400 |
| 2017 | $3,554 | $104,900 | $18,500 | $86,400 |
| 2016 | $496 | $104,900 | $18,500 | $86,400 |
| 2015 | $496 | $104,900 | $18,500 | $86,400 |
| 2014 | $3,296 | $104,900 | $18,500 | $86,400 |
Source: Public Records
Map
Nearby Homes