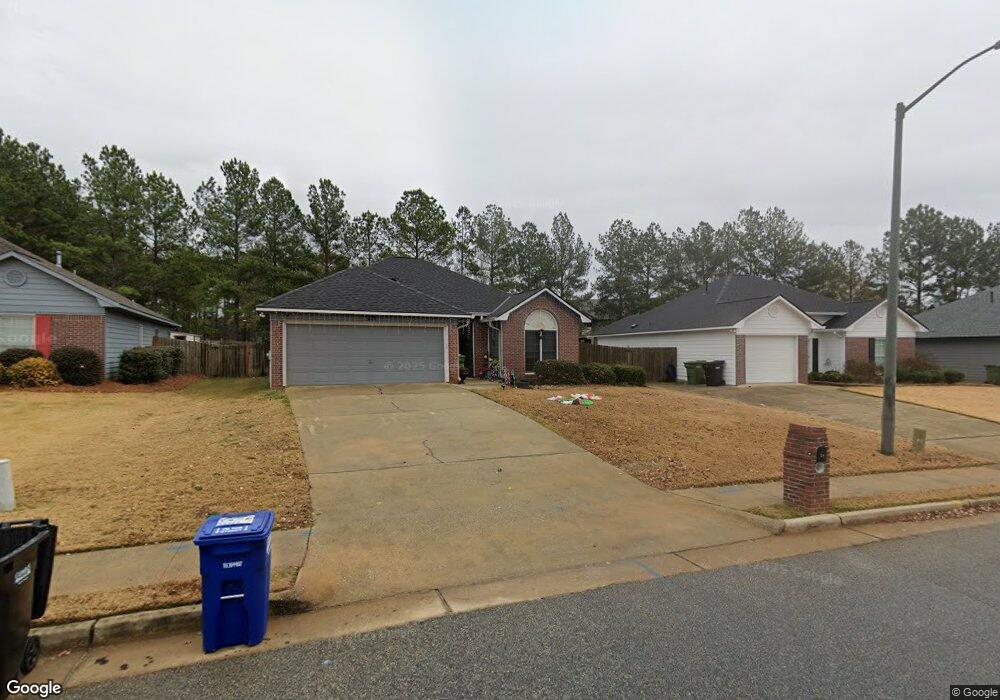
28 Peppertree Ct Columbus, GA 31909
Northern Columbus NeighborhoodEstimated Value: $231,000 - $263,000
3
Beds
3
Baths
1,468
Sq Ft
$168/Sq Ft
Est. Value
About This Home
This home is located at 28 Peppertree Ct, Columbus, GA 31909 and is currently estimated at $246,742, approximately $168 per square foot. 28 Peppertree Ct is a home located in Muscogee County with nearby schools including Double Churches Elementary School, Double Churches Middle School, and Northside High School.
Ownership History
Date
Name
Owned For
Owner Type
Purchase Details
Closed on
Nov 17, 2016
Sold by
Wynn Christopher M
Bought by
Wynn Kelli D
Current Estimated Value
Purchase Details
Closed on
Apr 2, 2010
Sold by
Us Bank National Association
Bought by
Wynn Christopher M and Wynn Kelli D
Home Financials for this Owner
Home Financials are based on the most recent Mortgage that was taken out on this home.
Original Mortgage
$151,182
Interest Rate
4.97%
Mortgage Type
VA
Purchase Details
Closed on
Nov 3, 2009
Sold by
Johnson Ayanna
Bought by
Us Bank National Association
Create a Home Valuation Report for This Property
The Home Valuation Report is an in-depth analysis detailing your home's value as well as a comparison with similar homes in the area
Home Values in the Area
Average Home Value in this Area
Purchase History
| Date | Buyer | Sale Price | Title Company |
|---|---|---|---|
| Wynn Kelli D | -- | -- | |
| Wynn Christopher M | $148,000 | None Available | |
| Us Bank National Association | $152,600 | None Available |
Source: Public Records
Mortgage History
| Date | Status | Borrower | Loan Amount |
|---|---|---|---|
| Previous Owner | Wynn Christopher M | $151,182 |
Source: Public Records
Tax History Compared to Growth
Tax History
| Year | Tax Paid | Tax Assessment Tax Assessment Total Assessment is a certain percentage of the fair market value that is determined by local assessors to be the total taxable value of land and additions on the property. | Land | Improvement |
|---|---|---|---|---|
| 2025 | $1,801 | $75,056 | $12,352 | $62,704 |
| 2024 | $1,800 | $75,056 | $12,352 | $62,704 |
| 2023 | $1,117 | $75,056 | $12,352 | $62,704 |
| 2022 | $1,877 | $61,860 | $12,352 | $49,508 |
| 2021 | $1,870 | $57,116 | $12,352 | $44,764 |
| 2020 | $1,871 | $57,116 | $12,352 | $44,764 |
| 2019 | $1,879 | $57,116 | $12,352 | $44,764 |
| 2018 | $1,879 | $57,116 | $12,352 | $44,764 |
| 2017 | $1,886 | $57,116 | $12,352 | $44,764 |
| 2016 | $1,895 | $65,800 | $10,400 | $55,400 |
| 2015 | $1,898 | $65,800 | $10,400 | $55,400 |
| 2014 | $1,901 | $65,800 | $10,400 | $55,400 |
| 2013 | -- | $65,800 | $10,400 | $55,400 |
Source: Public Records
Map
Nearby Homes
- 18 Peppertree Ct
- 7313 Sesame St
- 8008 Lagoon Ct
- 7407 Peppercorn Dr
- 7559 Crescent Dr
- 7185 Helen Dr
- 1719 Double Churches Rd
- 6818 Fawndale Dr
- 6810 Fawndale Dr
- 1512 Tom Buk Tu Ln
- 6817 Whitesville Rd
- 7995 Big Creek Place
- 1438 Grove Park Dr Unit 13B
- 6802 Ellis Dr
- 6825 Ellis Dr
- 1355 Cloverdale Rd
- 1440 Blanchfield Dr
- 7047 Mellwood Rd
- 6836 Sharmel Ln
- 6233 Ashwood Dr
- 30 Peppertree Ct
- 26 Peppertree Ct
- 24 Peppertree Ct
- 32 Peppertree Ct
- 22 Peppertree Ct
- 27 Peppertree Ct
- 25 Peppertree Ct
- 29 Peppertree Ct
- 34 Peppertree Ct
- 20 Peppertree Ct
- 21 Peppertree Ct
- 33 Peppertree Ct
- 0 Peppertree Ct Unit 7508014
- 0 Peppertree Ct
- 31 Peppertree Ct
- 17 Peppertree Ct
- 35 Chive Ct
- 39 Chive Ct
- 16 Peppertree Ct
- 15 Peppertree Ct